
Superatlas Goes Vector! Part III: How to Modify the OSM Data Selection and/or Mapbox/Maplibre Rendering Styles
In this last (and longest) part of the Superatlas-goes-vector-series I’ll explain how to influence the process of selecting OSM data and adding them to the vector layers. This mainly revolves around a LUA script, which implements the logic of OSM object selection, filtering and attribute processing. I will also explain how a Mapbox style can be modified, and how to adjust the symbols and fonts used by the style. So, if you do not like my style (which I can fully understand 🙂 ), this is a must-read for adjusting everything to your preferences.
The following steps will be covered:
- Selecting the OSM data for the map
- The tilemaker configuration file
- The basic structure of the tilemaker LUA process script
- Concepts in my LUA script
- Controlling map data rendering: The Basics
- Understanding Mapbox style files
- Map data sources
- A closer look on sprites
- Glyphs and how to create them
- The layer definitions
- One-Time-Setup for Style Editing
- Edit the style
- Prepare style file for editing
- Start tilemaker-server
- Loading the Superatlas style into Maputnik and making changes
- Bringing back the changes to OruxMaps
- Putting it all together
To understand this part, you should have read part II – also make sure that you have gone through the One-time-setup steps of part II – in this post I assume that you have these things ready.
A short disclaimer: My post may give the impression that I’m some kind of expert on Mapbox styles, LUA scripting or map data. This is not the case – I try to convey my current state of knowledge to help you to catch up and go beyond. I am well aware of some limitations – especially the LUA script certainly would benefit from a lot of polishing. It is the result of learning while going along, and as such far from perfect. I am also very sure that my Mapbox style is clumsily done in places. I’d strongly encourage you to improve things – and please, leave a comment for me and others to benefit from your learnings!
Credits
From the length of this part of my series you may guess how much of a learning curve all this was. It is not really complicated, but piecing things together was an interesting journey – I hope my write-up gives you a shortcut. I’ve already mentioned the people and software that helped me master this evolution of Superatlas in part I. I’d like to repeat my thanks to some selected people, because they were crucial to my success and thus indirectly made this post possible. I want to thank Tronpo, a cornerstone of the OruxMaps forum, who provided me with an example offline Mapbox JSON map for OruxMaps and helpful comments, which was invaluable to quickly grasp the concepts! My thanks go to Nakaner from the OSM community, who made me aware of tilemaker, which is the central part of my map creation workflow. Thanks are due to Richard Fairhurst and the other authors of tilemaker for creating and maintaining this piece of software!
Selecting the OSM Data for the Map
The general process is: Download PBF data from Geofabrik, then process it via tilemaker, and write it into an mbtiles database file. The mbtiles database contains one or more data layers – I decided to create a layer that contains points of interest (POIs), one layer that contains ways, and another layer that contains other features as lines and aeras. The main reason was a misunderstanding of how tilemaker works – there is no functional reason to do so. In principle everything can go into one layer. These data layers may be confused later with the layers in a Mapbox style – so be aware that these two layer types are not the same.
Into the data layers go the objects, i.e. nodes, ways/lines and areas. Which OSM objects are selected for this, and which properties of these OSM objects are taken into the final database, is governed by the process LUA script. Not unlike OSM, a node, a way or an area object can have attributes, and you are completely free to choose the names of these attributes. The attributes are later, in the style file, used to match drawing rules to the map objects.
OSM relations are also processed by the LUA script/tilemaker, and can be added as lines or areas, and receive attributes. So, all bases covered.
Configure tilemaker and the mbtiles Database
A simple JSON file gives tilemaker the information about which data layers are supposed to be in the database, which zoom levels it will cover and some metadata. Also, parameters can be given for data simplification for the lower zoom levels. The idea is that you would not need every node of a way at the less detailed zoom levels, and by simplifying areas and lines you can save data and processing requirements, i.e. time and energy. Basically this simplification effects are the only rationale for having zoom levels with vector data – in principle you could go with just one vector database that has all information in it, and use the style definitions to adjust map rendering to zoom levels.
The configuration is a simple JSON file:
|
1 2 3 4 5 6 7 8 9 10 11 12 13 14 15 16 17 18 |
{ "layers": { "OSMfeatures": { "minzoom": 9, "maxzoom": 13, "simplify_below": 12, "simplify_level": 0.0002, "simplify_ratio": 2.0, "filter_below": 10, "filter_area": 0.5 }, "OSMways": { "minzoom": 11, "maxzoom": 13, "simplify_below": 12, "simplify_level": 0.0002, "simplify_ratio": 2.0 }, "OSMPOI": { "minzoom": 9, "maxzoom": 13, "simplify_below": 10, "simplify_level": 0.0002, "simplify_ratio": 2.0, "combine_below": 12 } }, "settings": { "minzoom": 9, "maxzoom": 13, "basezoom": 13, "include_ids": false, "name": "Superatlas Vector", "version": "1.0", "description": "OpenStreetMap data overlay", "compress": "gzip", "combine_below": 12 } } |
I guess that this file is mostly self-explanatory, with the exception of the simplification parameters. But since I basically took the defaults, I refer you to the tilmaker documentation for reference and explanation. I yet did not look closer or try to optimize these settings – I trust the authors of tilemaker to have good defaults. Should I ever dig deeper here, I’ll update this section of my post.
The LUA Script Basics
The main magic happens in the LUA processing script. It tells tilemaker which objects to select for processing from the input file, how to process them and what to write to the database. For full details I again recommend to read the documentation of tilemaker.
The basic concept is to specify node_keys and way_keys, which are arrays of OSM keys or key-value pairs. All nodes (node_keys) or ways, lines, areas and relations (way_keys) that match these conditions, are processed – all other OSM data is ignored. For each node match, the function node_function() is executed, and for all ways, lines, areas or relations that are selected, the way_function() is executed. Within these functions you can apply basically any logic you want to decide if the OSM object goes finally into the database, and if so, into which layer and what attributes go along.
Optionally, you can also use relation_scan_function() to control which relations are selected, and the relation_function() to process relations and their logic. I must admit that the exact way tilemaker processes relations remains somewhat opaque to me – I seem to understand that if you do not use the relation… functions, relations are processed by the way_function. I had my frustrations with relations, which I got under control by using the specific functions – so good enough for me at this point.
Within the processing functions you use the Layer() function to add an object to a data layer, and the Attribute() funtion to add attributes to the object afterwards. To make use of the OSM data in the logic, the Find() function allows you to search for OSM key and get its value, or the Holds() function to check if an objects has a specific key at all. There are many more directives you can use – refer to the documentation, or find other people’s LUA scripts for tilemaker to copy their ideas – I found that very helpful! The target of the functions is always the currently processed OSM object – remember that the processing functions are called for each OSM object that matches the initial filter.
Duplicates
There’s one caveat: The processing functions may process an OSM object multiple times – imagine that your node_keys select OSM objects like that:
node_keys = {“amenity”, “man_made”, “tourism = attraction”, “building”}
Now imagine an OSM object which is an observation tower with a small shop selling ice cream – it might have the OSM keys man_made = tower, tourism = attraction, building = yes and amenity = ice_cream. This object would now come up for processing four times! You might say: So what, if I want this to be in the data, then I add it to the data these four times. I prefer having it in the data only once, and add attributes. I suppose that this is more data and processing efficient. As a result, in my LUA script I test for such situations and reject duplicates. It took me a while to figure this out, so my duplicate rejection is not very cleverly done – I certainly will revamp this at some point in the future!
My LUA Script
If you want to modify my LUA script, here are a few pointers to help you understanding my logic. I know that it is difficult to pick up scripting or programming work others have done – so potentially you’re better off creating your own script, especially since mine is the result of learning while going along.
node_keys, way_keys and ValidXxx
In principle you can – aside from listing keys – put some logic already in these selection definitions. I found this quickly somewhat complicated, because it is only rudimentary logic possible. So I just list the OSM keys I am interested in and will do more filtering later.
For most keys I declared a ValidXxx-array (e.g. ValidHighways for the key highway), which contains all values of a key that I’m interested in. This I later use to reject all OSM objects that do not match. In rare cases I turned this logic around and have an InvalidXxx-Array.
TopLevelFeatures Array
Usually I select for a defined key-value pair, e.g. amenity = bench. There are however features where I need to look at the key, regardless of its value. Most of this kind to like fee = yes, but some can have any value, so I cannot simply test for “yes”. These features go into TopLevelFeatures array. An example wuld be ford, which can have values “yes”, “stepping_stones” or “boat”.
NonAreaFeatures, NonPOIfeatures Arrays
When putting objects into a data layer, you need to tell if they are an area or not. Some features, that may be an area in OSM, I still want to force to be treated as a line, and these go into NonAreaFeatures array.
If something is a line or an area, you can add also a point to the data that is the center of the area or line. I do this for some features, like e.g. archaelogical sites. The reason is that I do not want to have a line designating this archaelogical site – it would mean I’d need to remember all the different line styles and what they represent – but an icon in the center of it. This is more intuitive when reading the map. However, some feature I explicitly do not wnat to be processed this way, and that’s in NonPOIfeatures.
OutstandingFeatures Array
There are features I want to have at lower zoom levels visible, so they need to go into the regarding data levels. Mostly these are POIs that either are useful as orientation points, like towers or summit crosses, or POIs that I find usefull for quickly finding an attractive hiking area, like castles or waterfalls. They are listed in the OutstandingFeatures array.
Named Features
From zoom level 17 and deeper I like to have names for many, but not all features. Those features that should get names are listed in the NamedFeatures array. The color of the names is related to the feature, and to control the color, there are several NameColorXxx arrays, e.g. NameColorBlue. They contain the features for specific colors.
ValidFinalClasses and ValidPOIs Arrays
These are mainly for consistency checks. They contain all features I want to see in the map. If during processing a feature is added to the data that is not in these arrays, I get a warning message to see what I did wrong. With the complex selection rules this is helpful.
PriorityPOIs Array
Some POIs are the most important when hiking, and I want to make sure that they are not covered by other features. They go into this array.
contains Function
This function is a helper function to check if a value is or is not in a given array. I use this, e.g., to check if the value of a key is in the list of valid values.
OSMtranslator Function
This is the centerpiece for selecting objects. It is used both for the way_function and for the node_function. It does
- Selection based on ValidXxx-arrays
- Duplicate detection
- OSM object aggregation
This means merging OSM objects with different definitions into one target object class. An example would be that I want to have anything that has castle_type = palace, stately or manor all go into the object class “palace”. Or that I want to have both amenity = picnic_shelter, and amenity = pcinic_table that have covered = yes go into the object class “picnic_shelter”.
There are many, many objects in OSM which with very different key-value pairs mean the same, or nearly the same. This is partly because there are historic developments in the OSM data, or partly because the rules in OSM are not unambiguous. A lot of work went into tailoring this to my needs, but most of the work was already done when I created Superatlas as raster maps years ago. - Rejection of unwanted objects
This is unfortunately a classical spaghetti-code procedure, and in places not easy to understand. It also suffers from a constant evolution and would benefit from a considerable overhaul. Especially duplicate detection is not very well done and not 100% effective – that’s something I certainly will redo at some point.
CommonAttributes Function
This function contains the logic for setting some “standard” attributes (e.g. “name” or “attraction”) I make use of in the rendering rules. It is used both by the way_function and the node_function. It also makes use of the MinZoom(ZoomLevel) function from tilemaker: This tells tilemaker to include the object only for the more detailed zoom levels.
List of Attributes
The result of all this are objects that have some or all of the following attributes:
| Attribute | Meaning |
| class | What is it actually? Examples are “castle”, “path”, “church” or “protected_area”. Each object has at least this attribute. |
| subclass | In some cases giving more details for the class, e.g. “boardwalk” for a path with wooden surface, or “broadleaved” for class “forest”. |
| access | Can be “no”, “private”, “permit”, “customers” or “fee” |
| ConditionalAccess | The OSM description for conditional access – if possible specifically for access:foot:conditional. |
| fee | “yes” if access requires a fee. A bit inconsistent with the access attribute, something to implement better later. The reason is that for some objects I want to be able to combine “fee” with other access values. |
| ruins | If an object is a ruin, this is “yes”, else it is absent. |
| name | The name of the object for objects in the NamedFeatures array. Names are taken for the preferred languages (you can configure that at the top of the LUA script) – in my case the value of the OSM key name:de. If there is no name:de key, the value of the key name is taken. If name:de is given and also name has a value, the final name-attribute is name:de (name), e.g. “Mittagsberg (Poledník)” |
| name_color | “blue”, “brown”, “green”, “light_blue” or “black”. |
| outstanding | “yes” if part of the OutstandingFeatures array, otherwise the attribute would be absent. |
| attraction | “minor”, “major” or “outstanding”. A major attraction is an object that is already in the database and has OSM key/value tourism = attraction. A minor attraction is an OSM object with tourism = attraction that otherwise would not go into the database, based on the selection rules. Outstanding is a major attraction that also is part of the OutstandingFeatures array. |
| religion | The value of the OSM key “religion”. |
| priority | “yes” if part of the PriorityPOIs array – else absent. |
| difficulty | Hiking difficulty of ways and/or via_ferrata. |
| difficulty_color | “yellow”, “red”, “blue”, “generic” for the different SAC scale colorings (or the absence of SAC scale values) |
| trail_visibility | The value of the same OSM key |
| oneway | “yes” if one way, otherwise absent |
| geometry | “area” or “line” – mainly used for class “cliff” currently, since area lines have a different orientation as non-closed lines. This is a problem if you have line markings which need to have a specific orientation. Very annoying! |
These attributes are used to identify objects for specific rendering rules in the Mapbox style file. And how this exactly works, is part of the next chapters.
How to Control the Rendering of Map Data
Centerpiece of the map rendering with the Mapbox/Maplibre frameworks is a JSON file that defines map data sources, symbols, fonts and rules how map data is to be displayed. This is the style file. The data sources are web URLs that serve vector or raster map data. The symbols are stored in one large PNG image, the sprite, that is accompanied by another JSON file, that contains all information required to cut out the individual symbols from the PNG and how to reference them in the rules. Fonts are provided as glyphs, i.e. protobuf files containing the font rendering data. The rules finally define for objects from the data sources how they should be painted onto the map, using very basic drawing forms and the symbols and glyphs.
In the next chapters I’ll guide you through the individual building blocks mentioned above, and explain how they are structured and how you can create or modify them.
Mapbox Style
Mapbox style files are human-readable JSON files – if you never heard about JSON, don’t worry, it it simple enough to understand intuitively, and if you want to dig deeper, there are ample pages that give you all the details. If you want to look at a complete Mapbox style file, you may use the basemap.de relief style, or my superatlas.map.json. To explain the relevant building blocks, here’s the first few dozen lines of the basemap.de relief map style. There’s much more than I’ll touch here – if you’re interested, go for the full specification. And: I’m no expert in Mapbox styles – I just used what I need, potentially doing stupid things. Feel free to get better than me 🙂
|
1 2 3 4 5 6 7 8 9 10 11 12 13 14 15 16 17 18 19 20 21 22 23 24 25 26 27 28 29 30 31 32 33 34 35 36 37 38 39 40 41 42 43 44 45 46 47 48 49 50 51 52 53 54 55 56 57 58 59 60 61 62 63 64 65 66 67 68 69 70 71 72 73 74 75 76 77 |
{ "id": "bm_web_top", "version": 8, "name": "bm_web_top", "metadata": { "basemapde:style-version": 3.1, "mapbox:autocomposite": false, "mapbox:type": "template", "maputnik:renderer": "mbgljs" }, "center": [10,51], "zoom": 6, "glyphs": "https://sgx.geodatenzentrum.de/gdz_basemapde_vektor/fonts/{fontstack}/{range}.pbf", "sprite": "https://sgx.geodatenzentrum.de/gdz_basemapde_vektor/sprites/bm_web_top_sprite", "transition": { "duration": 300, "delay": 0 }, "sources": { "schummerung_col-beta": { "type": "raster", "attribution": "© 2024 basemap.de / BKG | Datenquellen: © GeoBasis-DE", "minzoom": 0, "maxzoom": 22, "tiles": ["https://sgx.geodatenzentrum.de/wms_basemapde_schummerung?tiled=true&bbox={bbox-epsg-3857}&service=WMS&version=1.3.0&request=GetMap&layers=de_basemapde_web_raster_colordem&styles=&crs=EPSG:3857&width=256&height=256&format=image/png&transparent=true"], "tileSize": 256 }, "schummerung_comb-beta": { "type": "raster", "attribution": "© 2024 basemap.de / BKG | Datenquellen: © GeoBasis-DE", "minzoom": 0, "maxzoom": 22, "tiles": ["https://sgx.geodatenzentrum.de/wms_basemapde_schummerung?tiled=true&bbox={bbox-epsg-3857}&service=WMS&version=1.3.0&request=GetMap&layers=de_basemapde_web_raster_combshade&styles=&crs=EPSG:3857&width=256&height=256&format=image/png&transparent=true"], "tileSize": 256 }, "smarttilesHL_de": { "type": "vector", "attribution": "© 2024 basemap.de / BKG | Datenquellen: © GeoBasis-DE", "url": "https://sgx.geodatenzentrum.de/gdz_basemapde_vektor/tiles/v1/bm_web_hl_de_3857/bm_web_hl_de_3857.json" }, "smarttiles_de": { "type": "vector", "attribution": "© 2024 basemap.de / BKG | Datenquellen: © GeoBasis-DE", "url": "https://sgx.geodatenzentrum.de/gdz_basemapde_vektor/tiles/v1/bm_web_de_3857/bm_web_de_3857.json" } }, "layers": [ { "id": "Hintergrund", "type": "fill", "source": "smarttiles_de", "source-layer": "Hintergrund", "layout": { "visibility": "visible" }, "paint": { "fill-color": "rgb(255,253,238)", "fill-opacity": 1 } }, { "id": "SiedlungF_TagebauGrubeSteinbruch", "type": "fill", "source": "smarttiles_de", "minzoom": 11, "maxzoom": 22, "source-layer": "Siedlungsflaeche", "filter": ["==","klasse","Tagebau, Grube, Steinbruch"], "layout": { "visibility": "visible" }, "paint": { "fill-color": "rgb(214,210,219)", "fill-opacity": 1 } }, [...] |
So, there’s some metadata (I guess it is self-explanatory – or irrelevant 🙂 ). Then there’s center, giving the starting point of rendering in [longitude, latitude], zoom giving the starting zoom value, and transition, which gives the parameters for zoom levels blending into each other when zooming.
I jumped across glyphs and sprite. glyphs gives the base URL where to find font rendering data – we’ll come to this in detail later. sprite is the base URL where to find sprite information, i.e. data for map symbols. We need to look at that in detail, also later in this post.
Follows the sources part. It contains one or more map data sources. They can be raster, vector, elevation models (dem) etc. In this post I’ll focus on vector maps, but it is good to remember that raster will also work. In terms of Superatlas, you can overlay the OSM vector layer to a raster map, e.g. for countries that do not offer vector maps (yet?). With an elevation model you could even display the map in 3D in OruxMaps, but I as of this writing did not go down that rabbit hole. Perhaps some time in the future, but as of now my use cases for 3D maps are limited.
Each source has an id and an URL where the map data can be found, and data sources can then have layers containing different data, which are not to be confused with the layers we’ll come to in a minute. The URL can have many formats – I’ll concentrate on a single one later when we dive into the details, but again it is worth to remember that this offers a multitude of possibilities which may allow you to combine different map services with ease.
Finally, the usually largest part of a style file are the layer definitions under layers. Each layer refers to a data source by its id (source), and describes rules (type, paint) how and at which zoom levels (minzoom, maxzoom) to render a specific kind of object or objects (source-layer, filter) from the source.
It is noteworthy that editing this style can be done in a simple text editor (and sometimes for bulk operations that’s even a good idea), but due to the complexity and multitude of possible options and values I recommend to use a dedicated style editor – my suggestion below will be Maputnik, the free editor that is part of the Maplibre open source project, a fork from Mapbox.
Now it is time to look into some building blocks in more detail.
Map Data Sources
While Mapbox allows for several different types of map data sources, the OruxMaps mbtiles-based map data delivery is a tiled map source, i.e. for both raster and vector maps the map area is cut into small squares, the tiles. Each tile contains the relevant data for a small region of the map, and by putting tile beside tile, you get larger regions. These tiles exist for longitude and latitude (x and y), and for different zoom levels (z). Typically, and also in OruxMaps, these tiles are delivered from a web server via http. So, to get a tile from this server, you query an URL that looks like http://my.web.server/tiles/{z}/{x}/{y}.pbf. Pbf would be a vector, protobuf formatted tile, png or jpg would be raster tiles. And yes, you can open the URL in your web browser – in case of a raster map you’d see the actual image for that tile – here’s an example from the raster OpenTopoMap:
https://a.tile.opentopomap.org/14/8518/5507.png
The web server OruxMaps runs for the purpose of serving tiles from a local mbtiles offline file listens to URLs like http://localhost:8998/MyMapFile.mbtiles/{z}/{x}/{y}.pbf. And that’s why the Superatlas map sources look like this in the style file:
|
1 2 3 4 5 6 7 8 9 |
"OSM-tiles": { "type": "vector", "tiles": [ "http://localhost:8998/superatlas.mbtiles/{z}/{x}/{y}.pbf" ], "attribution": "© OpenStreetMap", "minzoom": 9, "maxzoom": 13 } |
minzoom and maxzoom are important values: They tell Mapbox for which zoom levels the map source provides map data. This does not mean that you can’t zoom beyond these values – even with maxzoom 13 you can zoom in to zoom level 20, and with vector data this yields useful results (see part I if you need convincing).
The attribution is optional, but I’d consider it good practice to respect the terms and conditions of the map data provider.
Online Map Sources
That’s what we need for OruxMaps offline vector maps – so I’ll stop here, except for one remark: While I focus on offline map sources, I still typically have my Superatlas also available as online map source, i.e. the basemap data pulled directly from basemap.de. My OSM layer is still coming from an offline mbtiles file. And that’s simple – I just create a copy of my style file, and replace the URL for the basemap layer by the basemap.de-tile URL – that’s it. Here’s the two style file source sections for pure offline and for online:
|
1 2 3 4 5 6 7 8 9 10 11 12 13 14 15 16 17 18 19 20 |
"sources": { "smarttiles_de": { "type": "vector", "tiles": [ "http://localhost:8998/basemap.mbtiles/{z}/{x}/{y}.pbf" ], "attribution": "© 2023 basemap.de / BKG | Datenquellen: © GeoBasis-DE", "minzoom": 0, "maxzoom": 14 }, "OSM-tiles": { "type": "vector", "tiles": [ "http://localhost:8998/superatlas.mbtiles/{z}/{x}/{y}.pbf" ], "attribution": "© OpenStreetMap", "minzoom": 9, "maxzoom": 13 } } |
|
1 2 3 4 5 6 7 8 9 10 11 12 13 14 15 16 17 18 19 20 |
"sources": { "smarttiles_de": { "type": "vector", "tiles": [ "https://sgx.geodatenzentrum.de/gdz_basemapde_vektor/tiles/v1/bm_web_de_3857/{z}/{x}/{y}.pbf" ], "attribution": "© 2023 basemap.de / BKG | Datenquellen: © GeoBasis-DE", "minzoom": 0, "maxzoom": 14 }, "OSM-tiles": { "type": "vector", "tiles": [ "http://localhost:8998/superatlas.mbtiles/{z}/{x}/{y}.pbf" ], "attribution": "© OpenStreetMap", "minzoom": 9, "maxzoom": 13 } } |
You can see the potential hidden here I guess – and leave it there.
Sprites
I do not like the concept of sprites, but it is the only way of getting in custom symbols, so let’s deal with it. The base URL for the sprites is in the style, and for OruxMaps it would look like this: “sprite”: “http://localhost:8998/sprites/superatlas”.
This effectively means, that you get the following data:
- http://localhost:8998/sprites/superatlas.png
The actual image, which contains all symbols - http://localhost:8998/sprites/superatlas.json
The JSON file that tells Mapbox the coordinates and size of each symbol in the PNG, and its name - http://localhost:8998/sprites/superatlas@2x.png
The image in double resolution for high-dpi displays - http://localhost:8998/sprites/superatlas@2x.json
The according JSON with positions, sizes and names for this PNG - Potentially also …@3x… and …@4x… – OruxMaps seems to be content with having only the base and the @2x variants. basemap.de e.g. has also the 3x and 4x variants.
This is how the superatlas.png looks like:
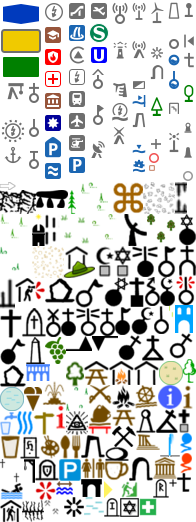
At the top you see all the symbols that basemap.de uses, below that the symbols I chose for the OSM layer. And here’s the first few dozen lines of superatlas.json:
|
1 2 3 4 5 6 7 8 9 10 11 12 13 14 15 16 17 18 19 20 21 22 23 24 25 26 27 28 29 30 31 32 33 34 |
{ "Bildung_Forschung": { "x": 42, "y": 24, "width": 22, "height": 22, "pixelRatio": 1, "visible": true }, "Feuerwehr": { "x": 42, "y": 46, "width": 22, "height": 22, "pixelRatio": 1, "visible": true }, "Gotteshaus": { "x": 88, "y": 66, "width": 20, "height": 36, "pixelRatio": 1, "visible": true }, "Kapelle": { "x": 148, "y": 136, "width": 16, "height": 16, "pixelRatio": 1, "visible": true }, [...] |
Each symbol has an entry with a name (sorry, the names above are in German, as they are from basemap.de), and the coordinate section. The name is later used to address the symbol in the rendering rules. pixelRatio is about the intended resolution, so in the @2x-file, it is 2, in the @3x file 3 and so on – a bit redundant IMHO.
What I do not like about this concept is that every time you want to add or change a symbol in the map, you have to re-generate the whole sprite, i.e. two PNGs and two JSONs. I yet have not found a tool that makes this an easy process – if you know one, please let us know via the comments. Things get even more complicated when – like here – you want to mix the sprites of two sources: basemap.de and my OSM layer. For basemap.de I can “only” download the full sprite, not the individual symbols. So I need to mix a ready made sprite with my individual icons, or first cut the basemap.de sprite into single images, and then recompile the sprite with all symbols.
Here’s what I currently do – which is far from perfect:
Create the Icons
First I create all symbols I want to use in target resolution and in double resolution. I use the Image Magick tools, that are part of basically any Linux distribution, on my Debian system to bulk scale all images via command line. Important are the following things:
- Images should all be PNG
- I recommend to create large symbols and scale them down rather than small symbols that you scale up.
- Mapbox struggles with some PNG subtleties – I yet did not really find out what exactly makes problems. I was however able to reduce the problems when I saved PNGs as RGB (not indexed or black/white), included a color profile and during bulk conversion enforced the RGB color space.
If you experience strange, distorted images in your map, try fixing your PNGs. A sure road to disaster was using PNGs generated from SVGs in Inkscape – I needed to run them through GIMP to straighten this out. - The PNG files for POIs should be named like the POI classes from the tilemaker process. This is optional, but if you do not do this, you considerably need to alter the style file later.
My scaled images go into a “1x” and a “2x” folder. Actually, in the beginning I thought I’d need them up to 4x resolution, so my icons are rather big and I scale them down with these commands:
|
1 2 3 4 |
mogrify -resize 25% -colorspace RGB -path icons/1x icons/*.png mogrify -resize 50% -colorspace RGB -path icons/2x icons/*.png mogrify -resize 75% -colorspace RGB -path icons/3x icons/*.png mogrify -resize 100% -colorspace RGB -path icons/4x icons/*.png |
Free Texture Packer
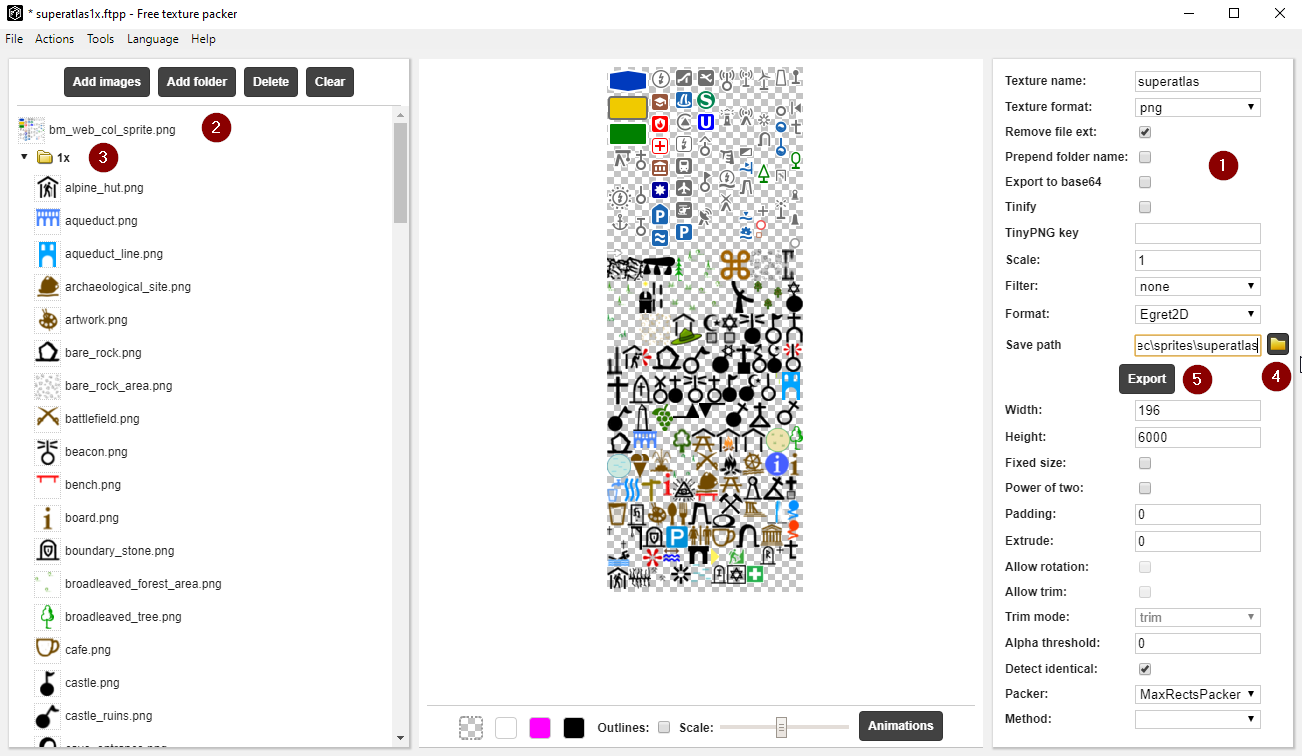
I use Free Texture Packer (Windows only, sorry) – this is as far as I understand for the creation of game sprites, but it does 95% of what I need. The steps are (after of course installing the tool):
- Set up the project – please refer to the screenshot below for the settings (right part of the window). The “Width”-value should minimum be that of the basemap.de sprite.
- Add the basemap.de sprite as it is (i.e. all icons packed already – click the link to download it) to the list of files to process (“Add images”)
- Add the “1x” folder to the list of files to process (“Add folder”)
- Make sure to select the target directory where the final sprite and JSON should be written to.
- Run “Export”. Before that, ensure that the basemap.de sprite is at the top left in the preview window! If it is not, you may have selected the wrong “Packer” or “Method” in the settings.
Finally, save this as a project – you’ll need this every time you make sprite changes.
Do the same with the 2x-files (basemap.de 2x sprite and the “2x” folder). In the settings, change the “Texture name” to “superatlas@2x”. Save this as an individual project – saves you tons of time.
You’ll get the spite PNGs and the according JSONs, but the JSONs need additional attention.
Modify and Merge Sprite JSON
The JSON Free Texture packer generates, looks like this (first lines only):
|
1 2 3 4 5 6 7 8 9 10 11 12 13 14 15 16 17 18 19 20 21 22 23 24 25 26 27 28 29 30 31 32 33 34 35 36 |
{ "file": "superatlas", "frames": { "bm_web_col_sprite": { "x": 0, "y": 0, "w": 196, "h": 182, "hw": 98, "hh": 91 }, "oneway_line": { "x": 0, "y": 182, "w": 81, "h": 8, "hw": 40.5, "hh": 4 }, "cliff": { "x": 0, "y": 190, "w": 36, "h": 24, "hw": 18, "hh": 12 }, "mixed_forest_area": { "x": 81, "y": 182, "w": 32, "h": 32, "hw": 16, "hh": 16 }, [...] |
Following problems:
- Coordinate data do not follow the sprite JSON format
- The basemap.de-sprite is referred to as one, large image, not as individual images.
- There are additional lines/JSON layers (file, frames) that we do not need
The additional lines are easy: Just remove them, but do not forget the matching curly brackets at the file’s end.
The coordinate syntax correction is also not too difficult – a few search’n’replace actions:
- Replace “w” with “width”, “h” with “height”
- Replace “hw”: .. with “pixelRatio”: 1 (or 2 for the 2x files)
- Replace “hh”: .. with “visible”: true
For the last two operations you’ll need to use either regular expressions, because the numbers will not always be the same, or use an editor that supports macros and record a good one. I anyhow recommend to use macros and save them – each time you redo the sprite you’ll need to repeat the actions. I personally use Notepad++ for this.
Finally, get the JSON file for the basemap.de sprite (and that for the 2x sprite) – click on the links for download. Now replace the “bm_web_col_sprite”: {…} part of the Free Texture Packer generated JSON with the content of the basemap.de JSON – which is having the right coordinate information for that part of the resulting sprite. This works only if the basemap.de sprite is top left in the final sprite – observe step 5 in the Free Texture Packer task list! Double check your curly brackets and commas!
Here’s before and after:
|
1 2 3 4 5 6 7 8 9 10 11 12 13 14 15 16 17 18 19 20 21 22 23 24 25 26 27 28 29 30 |
{ "file": "superatlas", "frames": { "bm_web_col_sprite": { "x": 0, "y": 0, "w": 196, "h": 182, "hw": 98, "hh": 91 }, "oneway_line": { "x": 0, "y": 182, "w": 81, "h": 8, "hw": 40.5, "hh": 4 }, "cliff": { "x": 0, "y": 190, "w": 36, "h": 24, "hw": 18, "hh": 12 }, [...] } } |
|
1 2 3 4 5 6 7 8 9 10 11 12 13 14 15 16 17 18 19 20 21 22 23 24 25 26 27 28 29 30 31 32 33 34 35 36 37 38 39 40 41 42 43 44 |
{ "Bildung_Forschung": { "x": 42, "y": 24, "width": 22, "height": 22, "pixelRatio": 1, "visible": true }, "Feuerwehr": { "x": 42, "y": 46, "width": 22, "height": 22, "pixelRatio": 1, "visible": true }, [...] "U_Bahn": { "x": 88, "y": 44, "width": 22, "height": 22, "pixelRatio": 1, "visible": true }, "oneway_line": { "x": 0, "y": 182, "width": 81, "height": 8, "pixelRatio": 1, "visible": true }, "cliff": { "x": 0, "y": 190, "width": 36, "height": 24, "pixelRatio": 1, "visible": true }, [...] } |
It is a good idea to load the final JSON file into your web browser – if you forgot something (commas, curly brackets etc.), you’ll get helpful error messages:
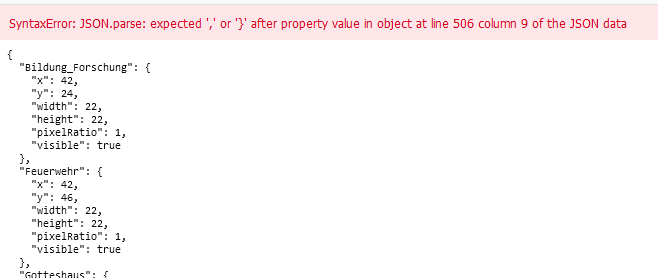
This JSON modification is the most excruciating (and error prone – beside the JSON syntax, I sometimes get “pixelRatio” wrong…) part of the sprite generation – I’ll certainly at some point optimize this step!
Caching Issues
Last remark: We will use these files later when we edit the Mapbox style in Maputnik. Due to some JavaScript caching methods (at least that’s what I assume), sprite changes are not recongnized by Maputnik after exchanging the files. Closing the browser and restarting interestingly does not solve it! For me, only restarting the computer cleared the cache! And the same holds true for OruxMaps – only a restart of the smartphone makes OruxMaps pick up changed sprites… Man, do I hate this sprite concept…
Glyphs
Like the sprite concept, the rationale behind glyphs escapes me. Fortunately, handling and generating glyphs is not such a nightmare as the sprite thing – on the contrary, it is straightforward.
The base URL in the style for glyphs is – for OruxMaps – http://localhost:8998/fonts/{fontstack}/{range}.pbf. Mapbox will generate the URL it then tries to load by replacing {fontstack} with the name of the font, and {range} with the range of 256 characters that contains the Unicode character that is currently to be rendered. As an example, if the text that needs to go to the map contains the ogham rune “ᚃ” (Unicode 5763) and the Font this character should be rendered in is “Noto Sans Italic”, Mapbox would ask for http://localhost:8998/fonts/Noto%20Sans%20Italic/5632-5887.pbf. As Unicode covers 65536 characters, each font requires 256 glyph files to cover the whole range. And that’s what I do not get: For sprites they squeeze everything into one image – but for fonts, where you could have a single true/open type file per font, they create effing 256 files for each… If you can explain this to me, feel free to leave a comment!
In my Github repository you’ll get the glyphs for ~10 fonts – among them some Noto fonts, which are noteworthy, as Google, Monotype and Adobe in a joint venture work on developing the Noto fonts to cover the whole Unicode 6.2 standard. In more practical terms this means that with this font you’ll be able to have text from the most exotic regions of the world rendered successfully.
If you need another font, the procedure is easy:
- Locate an get the regarding open type or true type font (otf/ttf)
- Go to Maplibre’s font maker
- Upload one or more otf/ttf files and click “Convert”
- Wait for the magic to happen
- Optional: Check how well your font(s) do support international characters by looking at the example map
- Download a ZIP file with the glyphs.
Neat!
The Layer Definitions
The last part of the style file are the layer definitions. A layer definition is the rule set that declares how a class of objects in the map data is to be drawn on the map. The logic of the layers is:
- Select the object(s) the rendering rule should be applied to – for this
- Specify the data source (i.e. the ID of the map source that is supposed to have the regarding objects in it) – this is defined in the sources part of the style.
- Specify the source layer the objects would be in (This is a bit confusing: We have layers in the data sets, and layers for rendering – the layer to be specified here is a layer in the dataset. When we later come to the creation of mbtiles files, things will become more clear). This is defined in the map database – in our case the mbtiles file.
- Specify a filter – based on attributes of the objects in the map data (as set during the tilemaker processing) you can select the objects in question.
- Define when and how the objects are rendered:
- Specify the minimum and the maximum zoom the objects should be drawn – these values do not need to be integers – you may specify something like 10.999.
- Specify the type of the rendering – this can be line, circle, symbol, area fill, text and some more.
- Specify the detailed parameters of the rendering, like color, line width, opacity, font and much more. These parameters may be functions. An example would be to adjust the size of a symbol or the line width to the zoom level – like making it larger when zooming in. But much more complex things can be done.
To explain it all in detail here would be repeating the layer reference of Mapbox. And honestly, I’m only scratching at the surface myself. The best way of tackling this is to use an editor that allows an intuitive access to the complexity – and that’s why the next sections will describe the necessary steps to prepare the use of Maputnik as a style editor.
One-Time-Setup for Editing the Style in Maputnik
For the Mapbox/Maplibre JavaScript frameworks, map data comes in via web server requests. For the data from basemap.de this is straightforward, since we can use the basemap.de endpoints directly. For a local mbtiles file, i.e. the Superatlas OSM layer, there is no readily available web server that provides the mbtiles content. In part II you have set up tilemaker, and with tilemaker comes also tilemaker-server, and that’s exactly what we need: A web server that accepts an mbtiles file and listens for tile requests.
Unfortunately this is not good enough: tilemaker-server listens to http requests – but the Maputnik editor expects https – i.e. encrypted, secure http. tilemaker-server is not capable of handling this. There are several ways to solve this issue:
- Install a https-capable tile server
There are a few of them, and some support https. Potentially, this is the more clever way compared to what I did, which is - Configure a reverse-proxy and route tilemaker-server through that
A reverse proxy basically is listening to web requests and forwards them to another web server – potentially doing things with the request inbetween. In my case the reverse proxy would listen to https requests and forward them to tilemaker-server via http (without the s).
The reason why I chose the second option is mainly that I did not want to find and install yet another software and learn to operate it. As a reverse proxy you can very well use the venerable nginx workhorse web server, and this is for me a well-known piece of software. Feel free to choose the first option – I guess it has its benefits.
Setting up nginx as a Reverse Proxy for tilemaker-server
Secure https means that you need a server certificate with the corresponding private key. And here’s perhaps one advantage of going for another tile server – mbtileserver seems to handle this via the Let’s Encrypt CA, which is an easy and secure way of handling certificates. Still, I went for the old fashioned OpenSSL, with the disadvantage to have only a self-signed certificate which I actively need to authorize in my browser.
Sounds complicated – it is not!
Creating a Self-signed Certificate with OpenSSL
If you do not have OpenSSL installed, install it – on Linux: apt install openssl.
To create a private key and a certificate request, run
openssl req -newkey rsa:2048 -noenc -keyout MyWebserver.key -out MyWebserver.csr
Replace MyWebserver.key and MyWebserver.csr with names you like, and make sure they are stored in a secure location. The -noenc option is important. Not given, the private key would be protected by a passphrase. Since nginx cannot enter a passphrase, it would not be able to use the key later (this is oversimplified, but I do not want to dig into setting up a secure web server. There are plenty of tutorials out in the wild on that).
When you run this command, you’ll be asked a lot of questions – let me walk you through this:
Country Name (2 letter code) [AU]:DE
State or Province Name (full name) [Some-State]:Northrhine-Westphalia
Locality Name (eg, city) []:Bonn
Organization Name (eg, company) [Internet Widgits Pty Ltd]:Hauke’s Projects
Organizational Unit Name (eg, section) []:IT
Common Name (e.g. server FQDN or YOUR name) []:localhost
Email Address []:projects@webvoss.de
Please enter the following ‘extra’ attributes
to be sent with your certificate request
A challenge password []:
An optional company name []:
For Country name, State, Locality Name, Organization Name and Organizational Unit Name you can basically enter what you want, it is of no consequence. Important is Common Name: If you plan to run nginx on the same computer you want to use Maputnik on, localhost is the right choice here. If you plan to run Maputnik on a different computer, your nginx would need to be accessible via some domain name, e.g. my.webserver.local. In that case, my.webserver.local would be the value to go in for Common Name. Finally, Email Address is again of no real consequence, but OpenSSL checks for valid email-syntax, so enter something that resembles an email address – no need that this really exists. Important again: Make sure that you leave the challenge password empty.
The second step is the actual certificate signing – run this command:
openssl req -key MyWebserver.key -in MyWebserver.csr -x509 -days 3650 -out MyWebserver.crt
3650 days is ten years – do not use this for any public web server! This is by the way true for the whole setup here: it is only intended for internal use – I’d strongly discourage to publish the tile server this way to the internet.
After this, you’ll have three files: MyWebserver.csr, MyWebserver.key and MyWebserver.crt. The .csr file is of no use anymore, you can delete it. The other two need to go to a secure directory where nginx can access them. On Debian the right path for that is /etc/nginx/ssl-certs.
Configure nginx as a https Reverse Proxy
If not already installed, install nginx. On Linux: apt install nginx.
Locate the nginx configuration. On Linux this would be /etc/nginx/ – in there usually is a directory named sites-available. There’s a file named default, and that’s what is to be modified – with the following content:
|
1 2 3 4 5 6 7 8 9 10 11 12 13 14 15 16 17 18 19 |
server { listen 443 ssl default_server; listen [::]:443 ssl default_server; server_name my.webserver.local; ssl_certificate /etc/nginx/ssl-certs/MyWebserver.crt; ssl_certificate_key /etc/nginx/ssl-certs/MyWebserver.key; root /var/www/html; index index.html index.htm index.nginx-debian.html; location / { proxy_hide_header Access-Control-Allow-Origin; add_header 'Access-Control-Allow-Origin' '*' always; proxy_pass http://127.0.0.1:8080; } } |
Change line 5 to server_name localhost; if you do not want to use a server name/domain name. Change lines 7 and 8 to match your key and certificate files.
Serve Static Content from nginx
Besides serving map data from the mbtiles files, we also need to serve the glyphs and the sprites. These are usually referred to as “static files” or “static content”. tilemaker-server can do this as well, but running it through the reverse proxy did trigger Maputnik’s cross-origin protection. I guess this is fixable, but I went down the road of least resistance and decided to serve static content directly from nginx. For this, a few more lines go into the configuration – here’s the final content:
|
1 2 3 4 5 6 7 8 9 10 11 12 13 14 15 16 17 18 19 20 21 22 23 24 25 26 27 |
server { listen 443 ssl default_server; listen [::]:443 ssl default_server; server_name my.webserver.local; ssl_certificate /etc/nginx/ssl-certs/MyWebserver.crt; ssl_certificate_key /etc/nginx/ssl-certs/MyWebserver.key; root /var/www/html; index index.html index.htm index.nginx-debian.html; location /sprites/ { add_header Access-Control-Allow-Origin *; } location /fonts/ { add_header Access-Control-Allow-Origin *; } location / { proxy_hide_header Access-Control-Allow-Origin; add_header 'Access-Control-Allow-Origin' '*' always; proxy_pass http://127.0.0.1:8080; } } |
Now put sprite files (those you got from my Github repository) into /var/www/html/sprites/, and glyphs (also from my Github – preserve the directory structure!) into /var/www/html/fonts/ – change the line root /var/www/html; if you want different directories, but make sure that the nginx system user can access this.
nginx needs to know the changes – either restart your computer, or trigger the reload of the config – on Linux issue the command: sudo service nginx reload
First Use: Make the Certificate Known to Your Browser
I think this step is only required if you did not chose to configure localhost as a server name above (i.e. you do not have Maputnik running on the same computer nginx is running on), but if you have configured your own domain like my.webserver.local. After setting this up, open your browser and navigate to https://my.webserver.local (i.e. your configured domain) – you’ll get a warning from your browser which tells you that this server is using a self-signed certificate. You need to accept this – the browser will remember and not ask again. Here’s how it looks in Firefox:
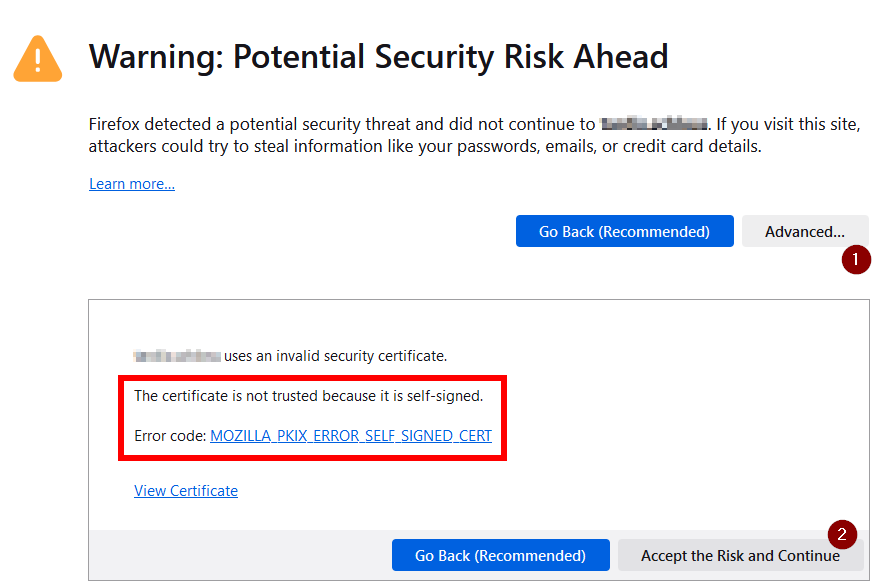
Btw.: If you click on “View Certificate” you’ll see all the “nonsense” values you entered when OpenSSL asked you all the questions.
Use Maputnik to Edit the Style
Prepare Style File for Editing
The superatlas.map.json file for OruxMaps is exactly that: Made for OruxMaps. This means, that the data sources are configured to point to http://localhost:8998/…. However, when we run Maputnik, these data sources will not be available, as a) we have no server listening to port 8998 (which we could change), and b) these are http and not https URLs (which we cannot change Maputnik to demand). So, we need a copy of the style and change the data sources. In the OruxMaps style file the sources section looks like that:
|
1 2 3 4 5 6 7 8 9 10 11 12 13 14 15 16 17 18 19 20 21 22 23 24 25 26 27 28 29 30 31 |
"sources": { "smarttiles_de": { "type": "vector", "tiles": [ "http://localhost:8998/basemap.mbtiles/{z}/{x}/{y}.pbf" ], "attribution": "© 2023 basemap.de / BKG | Datenquellen: © GeoBasis-DE", "minzoom": 0, "maxzoom": 14 }, "OSM-tiles": { "type": "vector", "tiles": [ "http://localhost:8998/superatlas.mbtiles/{z}/{x}/{y}.pbf" ], "attribution": "© OpenStreetMap", "minzoom": 9, "maxzoom": 13 }, "smarttilesHL_de": { "type": "vector", "tiles": [ "http://localhost:8998/basemap_contour.mbtiles/{z}/{x}/{y}.pbf" ], "attribution": "© 2023 basemap.de / BKG | Datenquellen: © GeoBasis-DE", "minzoom": 0, "maxzoom": 13 } }, "sprite": "http://localhost:8998/sprites/superatlas", "glyphs": "http://localhost:8998/fonts/{fontstack}/{range}.pbf", |
We need to change the two basemap.de sources to their original online content URL, and the OSM data source to the nginx server we setup as a proxy. The glyph and sprite URLs need to point to the static content via nginx:
|
1 2 3 4 5 6 7 8 9 10 11 12 13 14 15 16 17 18 19 20 21 22 23 24 25 26 27 28 29 30 31 |
"sources": { "smarttiles_de": { "type": "vector", "tiles": [ "https://sgx.geodatenzentrum.de/gdz_basemapde_vektor/tiles/v1/bm_web_de_3857/{z}/{x}/{y}.pbf" ], "attribution": "© 2023 basemap.de / BKG | Datenquellen: © GeoBasis-DE", "minzoom": 0, "maxzoom": 14 }, "OSM-tiles": { "type": "vector", "tiles": [ "https://my.webserver.local/{z}/{x}/{y}.pbf" ], "attribution": "© OpenStreetMap", "minzoom": 9, "maxzoom": 13 }, "smarttilesHL_de": { "type": "vector", "tiles": [ "https://sgx.geodatenzentrum.de/gdz_basemapde_vektor/tiles/v1/bm_web_hl_de_3857/{z}/{x}/{y}.pbf" ], "attribution": "© 2023 basemap.de / BKG | Datenquellen: © GeoBasis-DE", "minzoom": 0, "maxzoom": 13 } }, "sprite": "https://my.webserver.local/sprites/superatlas", "glyphs": "https://my.webserver.local/fonts/{fontstack}/{range}.pbf", |
Replace my.webserver.local by localhost or your domain name, as set up in the One-Time-Setup of nginx.
Start tilemaker-server
Setting up nginx as reverse proxy will not serve a single map tile – that can only be done by tilemaker-server, which we need to start from the command line. For this issue the command
tilemaker-server /path/to/superatlas.mbtiles
The content of the file under /path/to/superatlas.mbtiles is now served by tilemaker-server under http://localhost:8080/{z}/{x}/{y}.pbf – that’s why this turns up in the nginx reverse proxy configuration (as http://127.0.0.1:8080). As soon as tilemaker-server runs, tiles are served via nginx.
Port 8080 is often taken by other software, e.g. by Kodi‘s web interface. If you suffer from this condition, change the port a) in the nginx configuration (replace :8080 by :<yourport>), and b) when starting tilemaker-server:
tilemaker-server −−port <yourport> /path/to/superatlas.mbtiles
<yourport> should be something larger than 1024 (best practice). Perhaps it is even a good idea to change it to 8998 to mimic OruxMaps – saves you a bit of editing later 🙂
Now let’s dive into the actual style editor!
Loading Maputnik
This is the easiest part – launch your favourite browser and navigate to https://maplibre.org/maputnik/. It is noteworthy that while you load a resource from the internet, this is a JavaScript application, and it fully runs locally within your browser. It is not that it is running at Maplibre’s servers or so. And that’s why the editor would even be able to access things from localhost, which is impossible from internet servers outside of your network.
Load the Style File
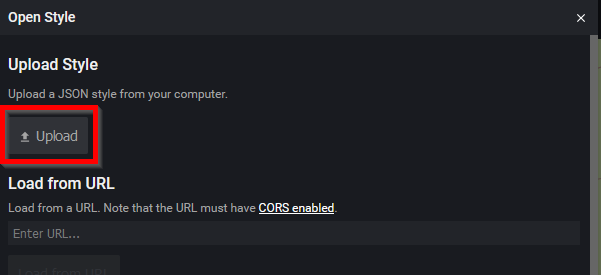
In Maputnik’s toolbar choose the “Open” button:

Now select “Upload” and choose the modified style file from “Prepare Style File for Editing” step:
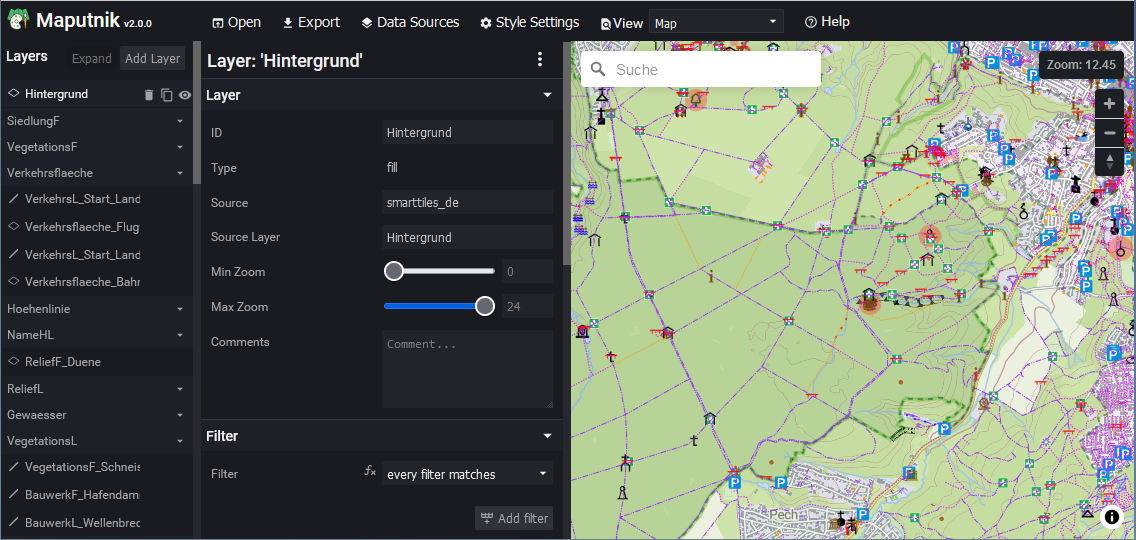
After that, Maputnik will load the style and fetch map data:
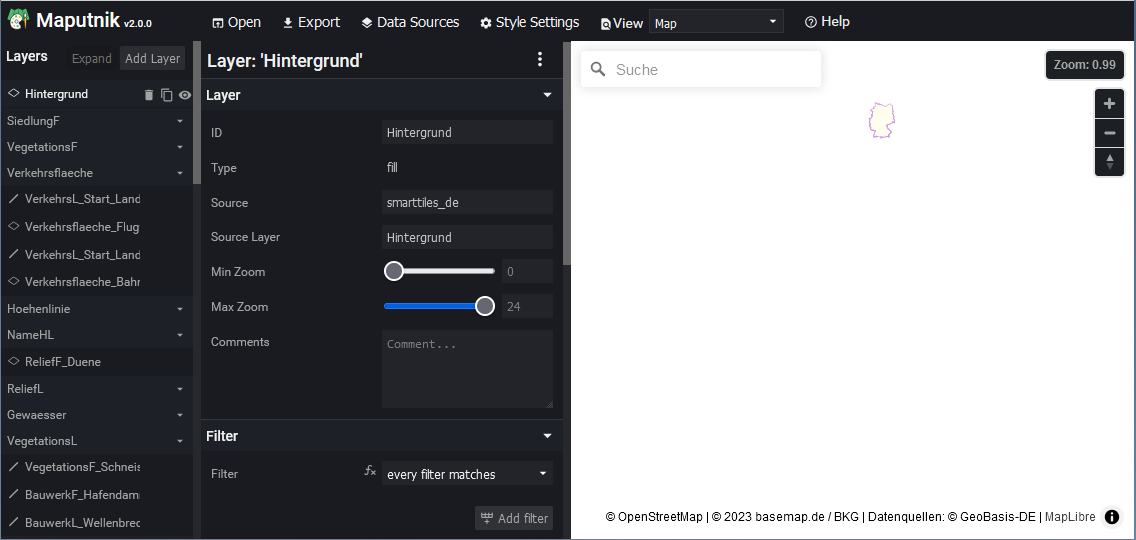
It somehow ignores initial zoom and center values given in the style, so you see a small map of Germany, but if you zoom in, you’ll see Superatlas in all its beauty – if not, something’s wrong with the style file:
And now we are ready for editing the style file.
Style Editing
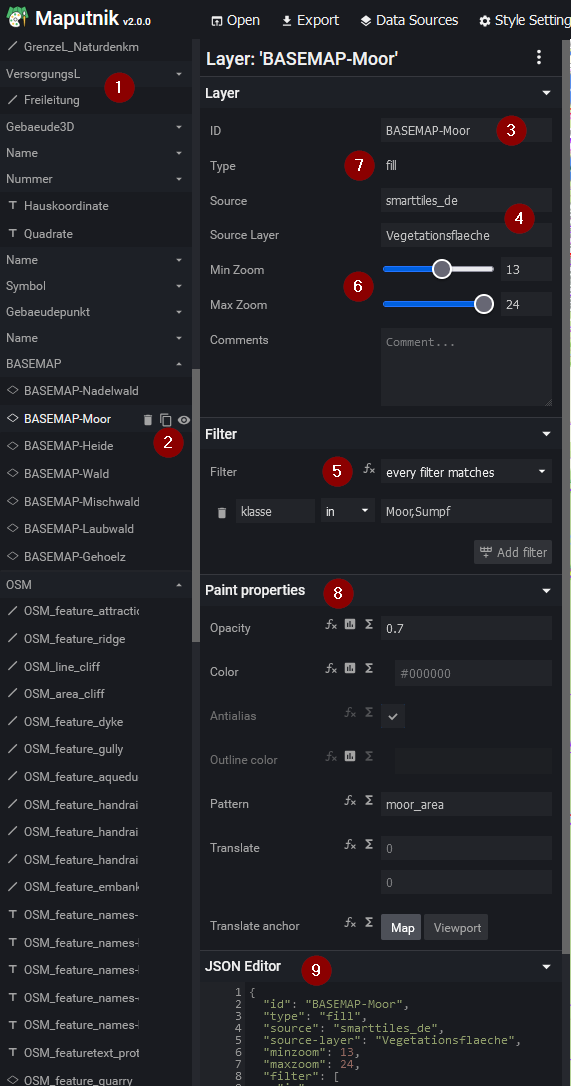
Remember the layers-section of the JSON style? That’s what we edit with the large toolbar on the left side of the editor window:
Let’s walk through the items:
- The layer list
All layers have an entry here. Maputnik tries to organize things a bit – it looks for the same prefix in the IDs of consecutive layers, and as long as the prefix stays the same, it groups them together. So all my layers start with OSM_, and therefore there’s a group “OSM”. - The active layer
If you click on a layer, you get a trashcan (delete layer), a copy-symbol (duplicates layer) and a visibility toggle. The visibility toggle is not only in the window, it goes into the style file. A layer invisible in Maputnik will also be invisible in OruxMaps later.
The details of the selected layer are then in the right part of the toolbar: - The ID (name) of the layer
- The data source and data layer to which the layer-definition should apply
- The filter, which based on object properties selects the objects
So in summary this layer applies to any object that comes from the data source and data layer (4) and matches the filter (5). Any object that matches all conditions is now drawn as defined in the layer. - Min and Max zoom
The selected objects will only be drawn if the current view’s zoom level is equal or larger than Min Zoom and equal or lower than Max Zoom.
Caveat: The object will not be drawn if the data source does not have it in its data for the regarding zoom level! - Type of what is drawn on the map.
Like line, circle, text, area fill etc. - Depending on the selected type (7), detailed properties that influnce the selected drawing type
Like color, opacity, pattern, text etc. - JSON editor
This shows the JSON that results from the values you selected for a layer. You can also directly edit the JSON here for exotic stuff.
An important fact to be noted is that layers are drawn in the order of appearance, i.e. the topmost layer is drawn first, then the next and so on. This means that later layers draw on top of existing layers, potentially covering already drawn symbols. It is a bit more complex than that, and there are more ways to control collision situations, but as a rule of a thumb it is as I said. Admittedly, I have not yet looked deeper myself how to govern collision situations, and I’m sure there’s lot of room for improvement.
If you scroll to the top of the layer list, there’s an “Expand” button which will expand all groups, and then become a “Collapse” button that collapses all groups. Also there’s “Add Layer” to create a new layer – but consider to instead duplicate an existing layer and edit that.
Finally, take a look at “Data Sources” and “Style Settings” – with the explanations in this post you should be able to understand what’s in there.
I will not walk you through each and every setting of the layers – a) because this would make this post extremely long and be a lot of work, but mainly b) because I’m scratching at the surface myself, so I encourage you to try out things for yourself. Existing styles should be able to give you a lot of guidance, and then there’s the Maputnik help pages, which you get when you click the “Help” button.
What I will do is guide you through a few concepts which I made use of in the Superatlas style.
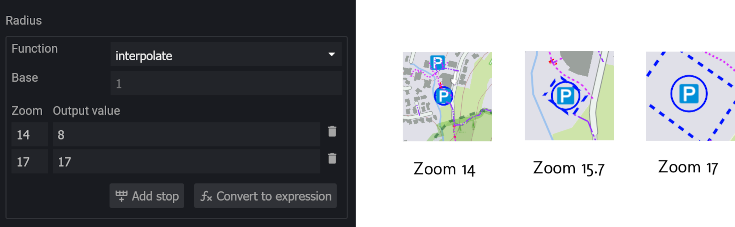
Zoom-Dependent Sizing
Parameters like linewidth or icon/symbol size can scale with the zoom factor. Here’s an example – I draw a circle around some POIs which indicates access rights. Blue means: For customers only. The size of the circle is smaller at lower zoom values, and larger at deeper zooms – for this there’s the “interpolate” function, which allows you to give 2 or more “stops” for which you define the target value. In the example, I define a stop at zoom level 14 for radius 8 pixel, and another one at zoom level 17 for a radius of 17 pixels. The actual radius will now be linearly interpolated between the two stops, so that the circle “grows” while zooming in. Beyond zoom level 17 it will remain fixed at 17 pixels:
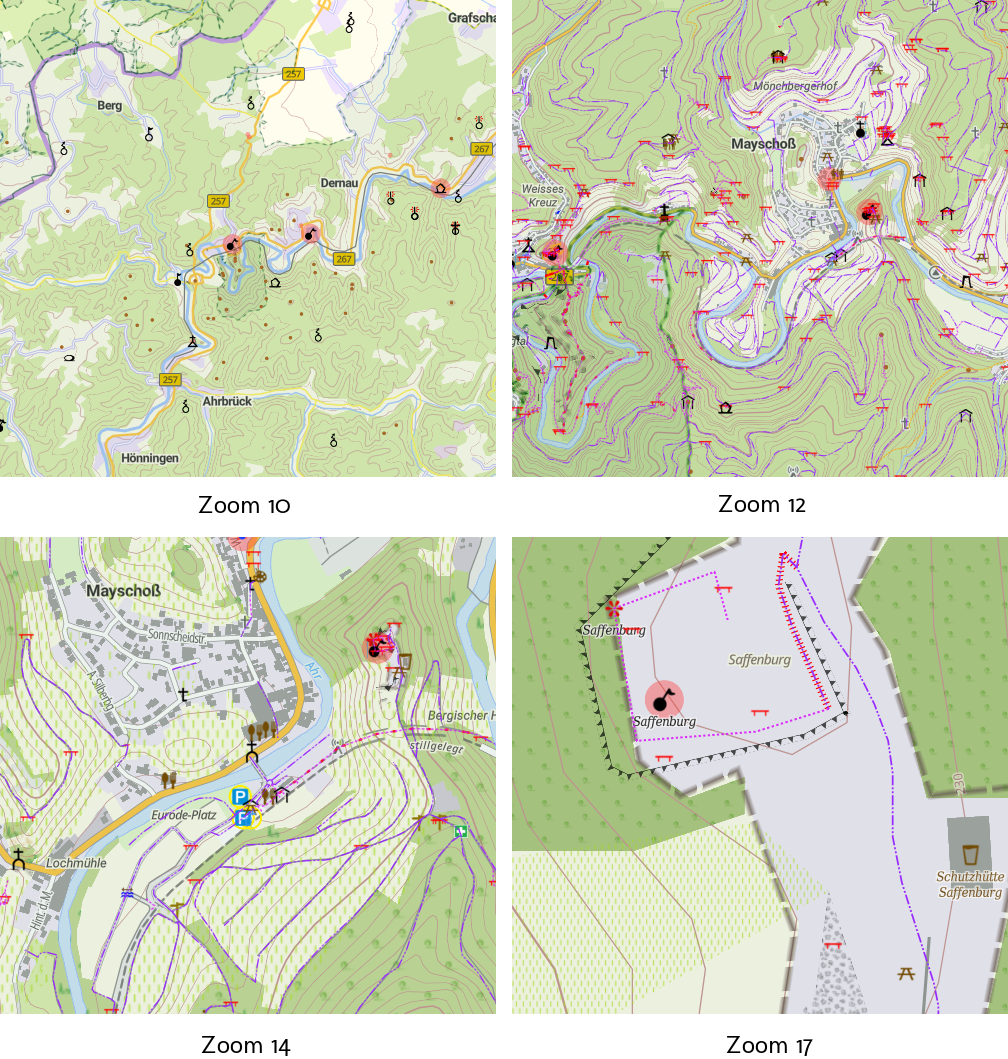
Min Zoom and Max Zoom
Increasing details with zoom level: By setting a Min zoom value (rarely also a Max zoom) you can control which items should show up, increasing the level of details while zooming in:
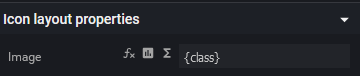
Using {class} Placeholder for Symbol Selection
The general category of my OSM objects is written into an attribute named class (see LUA script section). In my sprite, for each class that is supposed to be represented by an icon, there is an image that has the same name as the class it should be used for (defined in the sprite JSON). This allows me to have just one layer for POIs (a few more actually, but we come to this in a minute), where I give the name of the image in the format {class}. Mapbox will replace this with the class of the object it is just drawing, and thus by the correct image from the sprite.
Advantage: One rule for all POIs. Disadvantage: All POIs have the same other properties, which mainly means that you have to ensure that the POI images have the correct size.
Exporting the Style and Change URLs
When all is set up in Maputnik and you like what you see, the last step is to download the modified style and make it ready for OruxMaps. To download, select the “Export” button in Maputnik. In the following dialog, select “Download Style” – the other fields can stay empty:
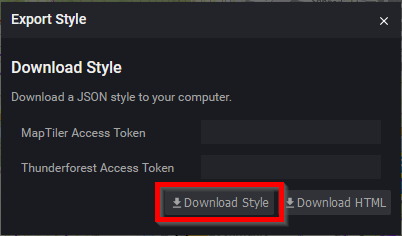
In your Downloads folder you’ll find the JSON style file – to prepare it for OruxMaps, to things need to be done:
- Make sure it ends with .map.json (only these are recognized as map sources in OruxMaps)
- Change all data source URLs back to http://localhost:8998/…
And that’s it!
Putting It All Together
Actually, not much to do anymore. We now have:
- The OSM layer mbtiles file
- The sprites
- The glyphs
- the style file
And these go into the regarding directories on the smartphone – here as a reminder the directory structure:
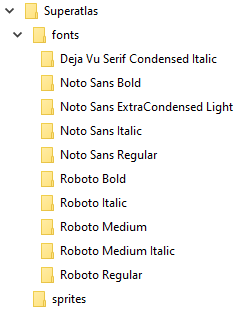
Obviously the sprite PNGs and JSONs go into sprites, any new glyphs into fonts, having a directory for each font, and the style JSON goes in the top level directory, Superatlas.
The names “fonts” and “sprites” can be changed – you need then to change them in your style file also.
Over time, you may want to have more than one map – I personally currently work on the Superatlas for Austria and Switzerland, which both offer vector maps. It is a good idea to add the style files all in the Superatlas directory: Doing this you can share the glyphs among many maps and do not need to create many copies in different directories! The glyph data does not so much cost storage space, but the 255 files for each font add up quickly, and the copy process takes quite long.
A last reminder of the curent bug in OruxMaps (see part II) – you may for the time being change the data source URLs in the style JSON to go to the Mobile Tile Server. Also keep in mind that changes to the sprites may need a reboot to take effect.
Final Words
I am using these maps now since a few months, and they have proven to be extremely useful. I was afraid that battery usage might be an issue, but Mapbox renders the map only once when navigating there for the first time, and after that it has a cache to read from. Battery usage is basically the same as with raster maps. I have also for our vacation in the Czech republic/Germany border region combined German vector, Czech raster and OSM vector layers successfully – all this is easy with the Mapbox style files! The only minor probem (aside from the tile server bug) I have yet encountered is that area fill patterns and line patterns at high zoom levels look a bit awkward – the scaling seems to break at some point, nothing to worry about.
During the change to vector maps I also made improvements and changes to my rendering style, which in theory also would work with the old raster map setup. I was shortly considering of trying to backport this, but decided against. The reason is mainly that I can combine the vector layer with raster maps, and I do not see a reason to have the old method up to date in parallel – it has become truely obsolete.
Getting here was intense – the concepts are a bit less intuitive as compared to the old Maperitive methods for raster maps. I still see much room for improvement – so stay tuned for updates! Refer to part II for the updates (or follow my Github repository), I’ll describe changes there. And finally: I am still scratching at the surface in many places – please share your ideas and solutions in the comments!