
Next Generation Perfect Offline Hiking Maps – Superatlas Goes Vector! Part I: Introduction
The survey offices of many countries now offer vector maps, so I adopted my previously raster map based hiking maps to use these vector maps. This results in much smaller map files, a sharper display and deeper zoom possibilities without the need to add more data. The data reduction now allows to store the OpenStreetMap (OSM) layer of my hiking maps for the whole of Germany in just about 650 MB. I also used this opportunity to revisit my OSM data selection and the general rendering, improving the maps considerably.
This is part 1 of 3, giving a general introduction – if you are just interested in using the maps, or if you already know why vector based maps are so much better than raster maps, you can skip it. Part II as the core piece explains how to use my maps and create the necessary map files yourself. Part III explains how to modify the OSM data selection, the rendering style and how to adopt for additional map sources – it requires the highest amount of tech savviness of the three parts.
Credits
Before jumping into the topic, some thanks are due. The learning curve for creating Superatlas Vector Edition was relatively steep, and I want to thank Tronpo for providing me with a first example map in the Mapbox/Oruxmaps format, which was an extremely helpful starting point! Also, thank to Nakaner from the OSM community, who gave me the pointer to tilemaker – and without that tool I guess I would not have found my way. Which brings me to Richard Fairhurst and the other authors of tilemaker – thanks for creating and providing this nice piece of software! Very approachable and helpful was Bogdan Hristozov, author of Mobile Tile Server, which I needed for an important workaround. For style editing I heavily leaned on Maputnik and thereby on the Maplibre framework – many thanks for these great pieces of software! Finally, thank you to the people providing and maintaining the software Free Texture packer, QGIS, Osmosis and nginx– software that is also a valuable part of my workflow. And of course Kudos and thanks to Jose Vasquez for maintaining OruxMaps as a one man show – impressive!
What’s the Problem?
In my blog post “Creating the ‘Perfect’ Hiking Map for Germany and other Countries” I have shown in detail how to create a hiking map that merges the very good maps of the survey offices of Germany and other countries with additional information from OpenStreetMap (OSM), namely an overlay that contains the OSM ways in a low-key rendering and many points of interest (POI) that I find relevant when hiking. Why I did this, is explained in the blog post in detail, read it if you’re interested. In short: I want to have the best of both worlds in one map. And this has not changed – I am using these maps with a bit of evolution now since a decade, and they have proven to be really the best possible maps for me.
One crucial thing is that I want the maps to be on my phone for offline use, working even if I have no data connection. This happens regularly for me, as I love to hike far away from densely populated areas, where the mobile phone network is often not reliable. So I store the map files in an SQLite database, that is then consumed by OruxMaps, my favourite hiking app. These maps consist of tons of small, 256 × 256 pixel raster images, called tiles, that depict a small area of the map at a given zoom level. Each zoom level is a factor of two regarding the distance-per-pixel, so for each deeper zoom level you need four times the number of tiles as for the previous zoom level – a factor of two in latitude and in longitude. This quickly adds up – a hiking map that covers my planned route, plus a bit left or right, at decent zoom levels, quickly is several hundred of megabytes in size.
Why Vector?
Enters: Vector based maps. Vector maps do not store the information as images. They store information based on nodes, i.e. data points that have a geographic coordinate (latitude/longitude), and additional property information, like, e.g., “I am part of a street” or “I represent a picnic table”. More complex structures, like a way, street or building, combine several nodes into a line, a polygon or an area, again adding information about their properties, e.g., “I am a castle” or “I am the border of a nature reserve”. This is a much, much more efficient way of storing map data, and it also has the huge advantage that it is not connected to a specific size or resolution. You can zoom in and out of vector data as much as you want at no loss of quality, without the need to store different vector data for different zoom levels. As a side remark, there are still zoom levels and different data for each zoom level in vector maps, but mainly for rendering efficiency – not because it would be absolutely necessary.
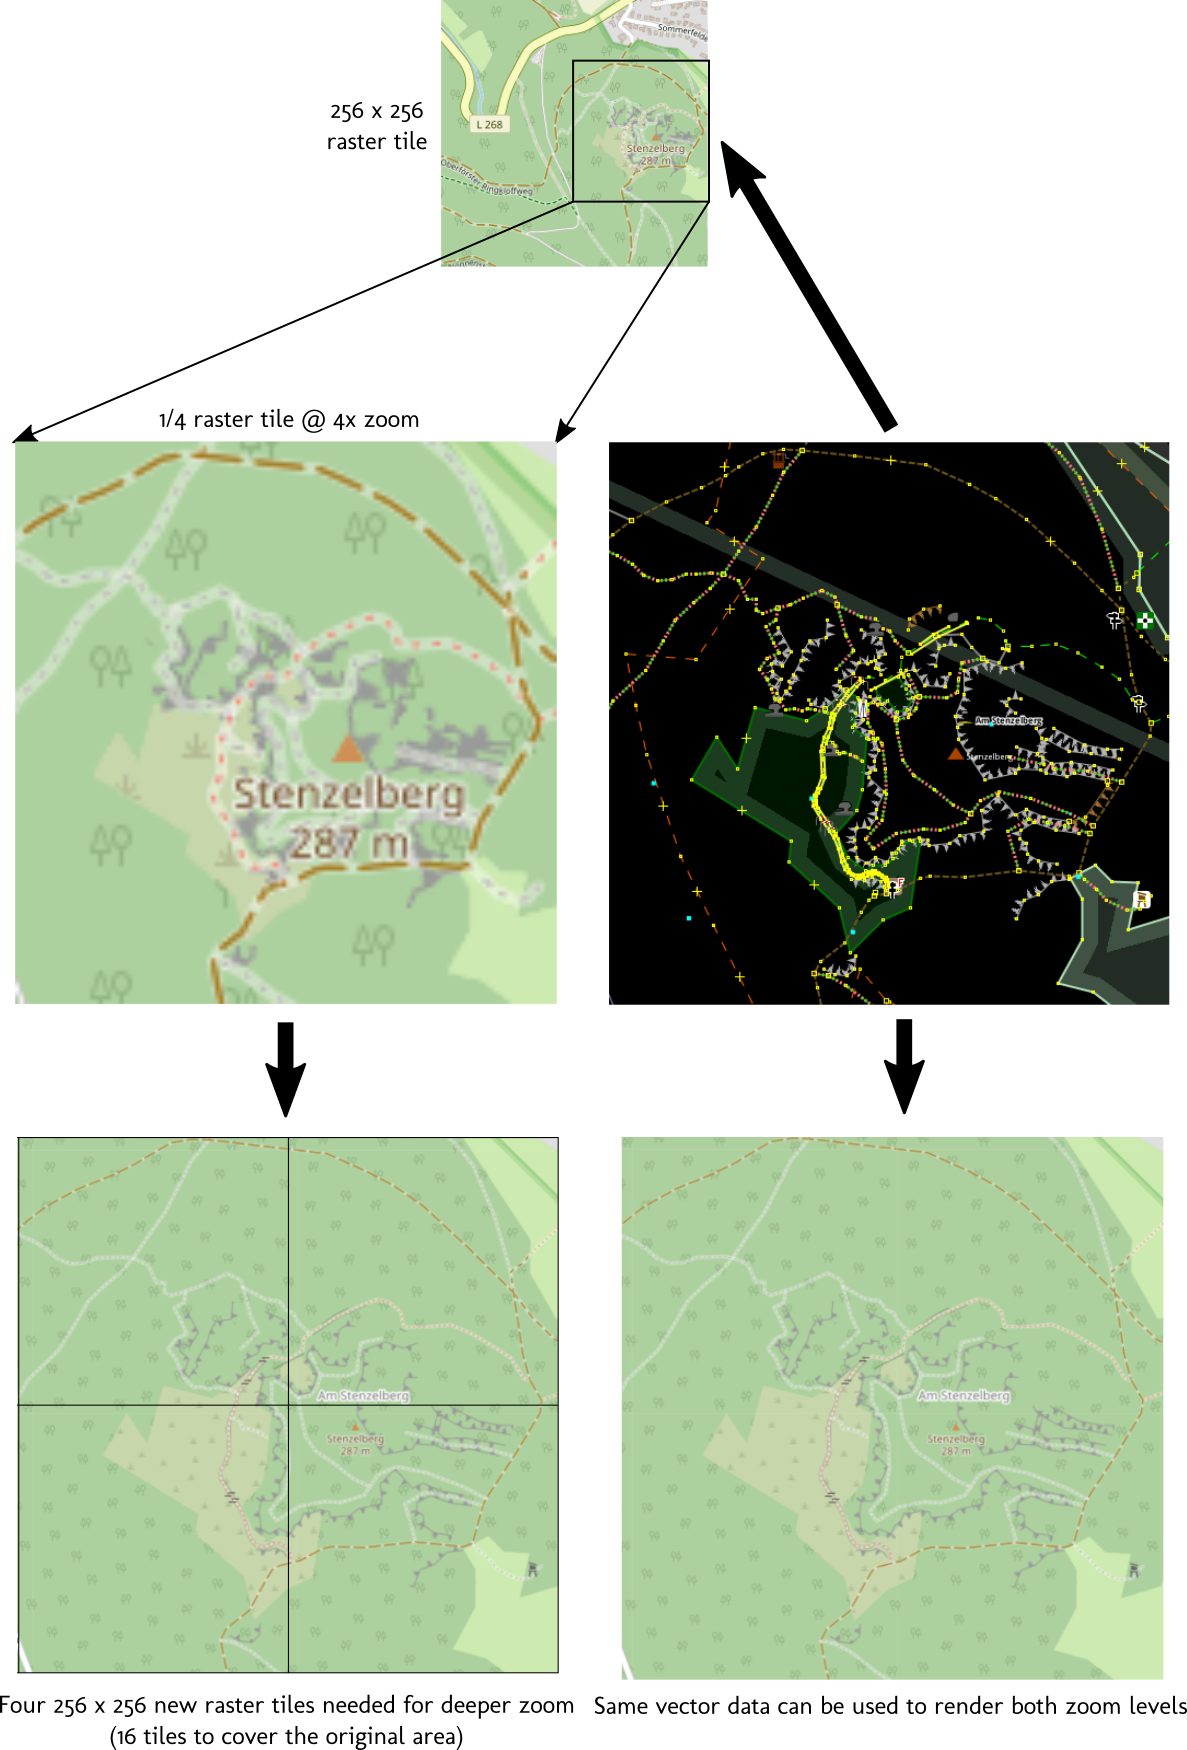
The following image shows the difference more visually: If you zoom in to a raster map just by blowing up the image, all you get is exactly the same pixels, just larger, without adding clarity or details. To gain resolution, and by that disentangle narrow features, you need to create new images with a better resolution. This is shown on the left side of the image below. The image in the middle right is a screenshot from JOSM, an editor for OpenStreetMap vector data – note how you can see the nodes as tiny yellow squares, and how just straight lines connect these nodes. The lines look differently, depending on the properties stored along with them. With vector data you can create the views for both zoom levels from the same data set, no additional storage space required. And even more views, highlighting different features, just changing the rendering style, but using the same data.
The advantages of vector maps over raster maps are considerable:
- Much smaller size: The same amount of data that I need to store half a dozen hiking areas is now enough to store complete Germany! Imagine that!
- Theoretically unlimited zoom: Vector maps can be rendered matching any zoom factor. In practice, most map software limits also vector zooming – but at a level that is more than enough for practical applications. To give an idea: If I store raster maps, the largest zoom level I use is 17 – which is a compromise of required data size versus zoom capability. With level 17, 99% of the map are OK, and the remaining 1% is crowded with information that would benefit from being able to zoom deeper. With vector maps the software limit is usually 20-24. OruxMaps goes to somewhere near level 21 – which means that my smartphone screen at maximum zoom shows an area of about 60 × 30 m – more than enough for any situation I yet encountered.
- Sharp and crisp rendering: While raster maps used PNG or JPEG tiles with considerably lossy compression, sometimes causing blurry parts in the map, vector maps can be rendered exactly right for a given resolution, and do not need compression for data efficiency.
- Ability to change the maps of the survey offices: If I do not like how a country renders their vector data, I an change the style file and have it my way. Examples are the Austrian vector maps, where they chose to render streets and paths in light gray, which is difficult to see in many situations (why did they? I’ve no clue…) and which I changed to a nice black. Or Germany, where they have excellent information about forests (broadleaved, coniferous, mixed), but do not make use of it in their rendering. I changed the rendering to include this information.
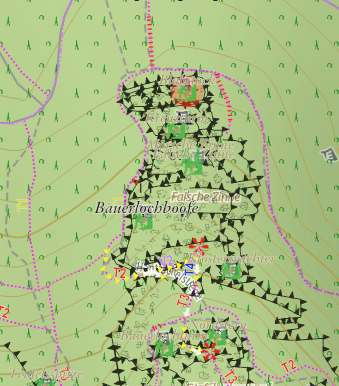
To illustrate the gain in clarity, here’s an extreme example of the 1% map parts that have difficulties with zoom level 17 – it is a part of the “Affensteine” in the Elbsandsteingebirge (Saxon Switzerland), and the feature I am especially interested in here is the “Häntzschelstiege“. Saxon Switzerland is an extremely beautiful region – if you love hiking, it is a must see! If you also like a bit of easy via ferrata climbing (most difficulty A or B, no gear needed IMHO), the Häntzschelstiege is highly recommended! When I look at the Superatlas raster map at my usually best zoom level 17 to locate the via ferrata, this is what I get:
Ouch… That’s not very good. You may think that the reason is that I try to squeeze too much information into one map. But in the mentioned 99% of all maps it is OK, and the information included is helpful and usually well accessible! This is just a very special region: If you look at the photo of the “Affensteine” below (looking at them from the west), you’ll understand why it looks as it looks (The map shows the outer left region of the photo):

My workaround was to create very small hiking maps for the difficult regions going to zoom level 18 or 19. This always meant long download and porcessing times, and a lot of additional storage space used on my mobile phone.
If I now take my new rendering based on vector data and zoom to the equivalent of raster level 17, it does not really look much better:
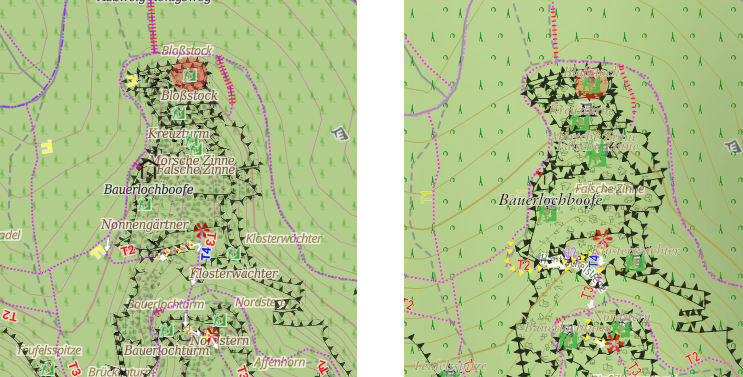
But with the vector map I just can continue to zoom in, using the same data:
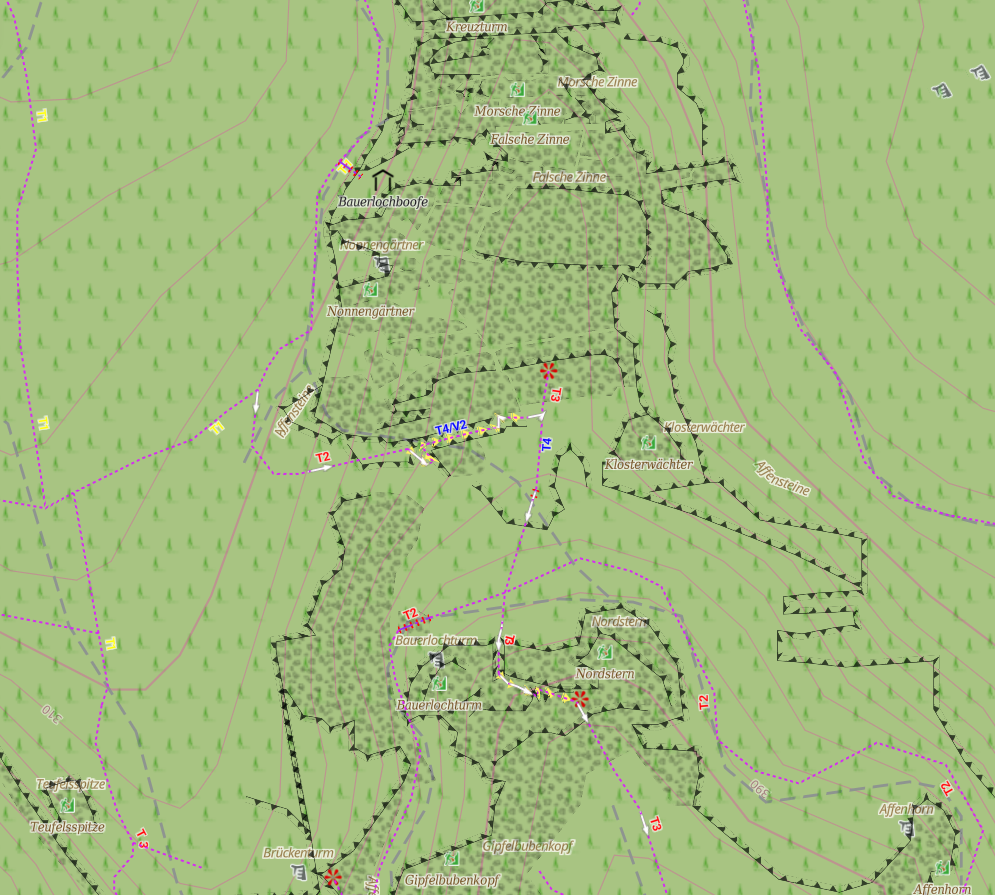
Now this is helpful, isn’t it? The yellow triangles are my rendering for via ferrata, so I can see where it runs. It is still not perfect – but zoom is not near its limit:
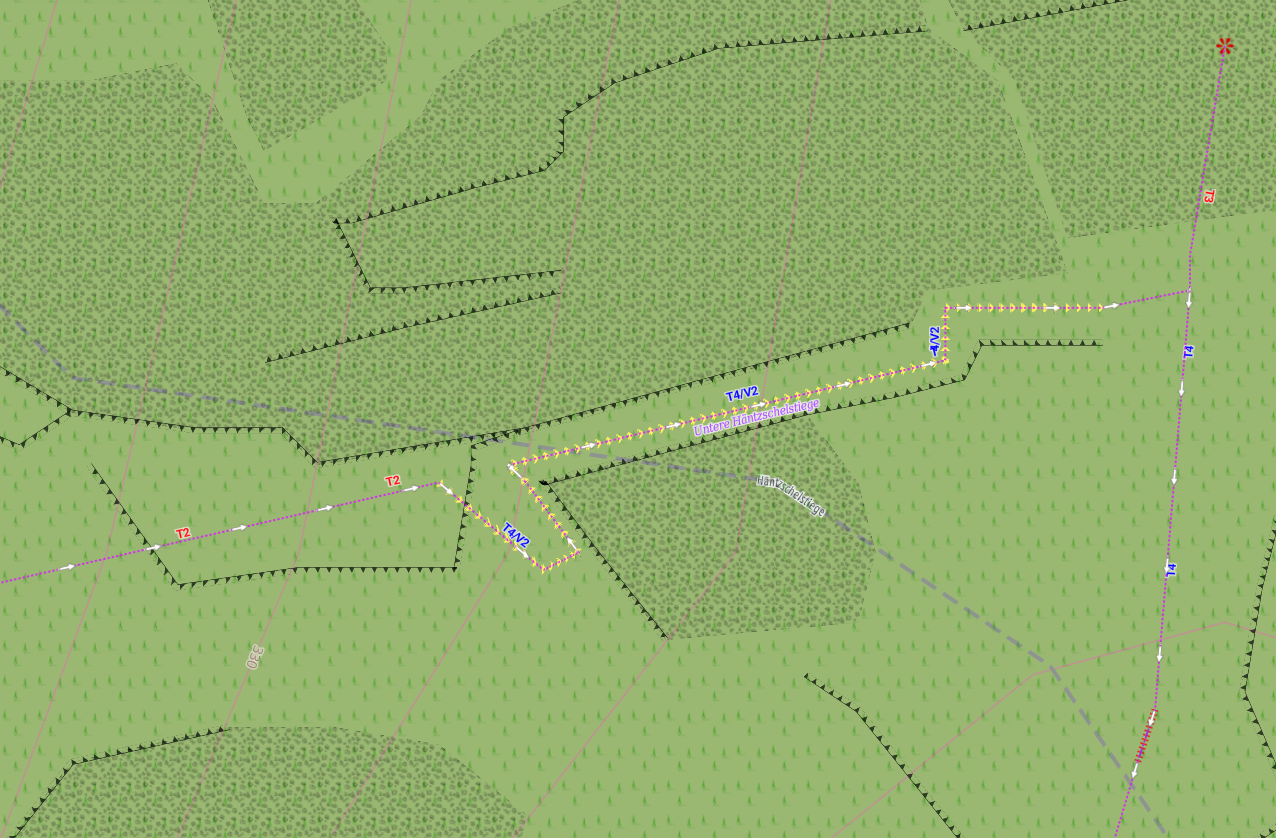
Now I have a precise view, and also the information that it is only the “Untere Häntzschelstiege” (i.e. the lower part), meaning that there is most likely an upper part, which I better do not miss.
I hope I’ve driven home my point. If you also want to make use of the improved vector Superatlas, continue reading part II!