
Superatlas Goes Vector! Part II: Creating and Using the Offline Vector Maps
In part I of this series of three posts, I introduced you to the benefits of using vector map data vs. raster map data. In this part I’ll explain the one-time-setup required to use the maps with OruxMaps, and the steps you will need to run each time you want to produce up-to-date map data.
The One-time-setup consists of:
- Registering for the Mapbox Premium maps (Paid feature of OruxMaps)
- Putting the base files on the smartphone (style, glyphs and sprites)
- Installing and preparing tilemaker
- Installing QGIS and adding data sources
- Optional: Installing Osmosis (depends on your use cases)
The map creation needs the following steps:
- Downloading OSM data files from Geofabrik (one or several, depending on your use cases)
- Optional: Merging the OSM data files (only required if your region is not covered by a single file)
- Creating the OSM layer mbtiles database via tilemaker
- Downloading the basemap.de vector tiles into a second mbtiles database via QGIS
- Optional: Downloading the basemap.de contour lines vector tiles into a third mbtiles database via QGIS
- Copying the two or three mbtiles files onto the smartphone
- Updating OruxMaps offline map database
If you are interested in modifying the rendering itself, i.e. the style, sprites and/or glyphs, please head for part III.
Updates
I am constantly improving my Mapbox style and my LUA script. Also, I’ll over time add more countries. Any significant updates I’ll write down here. Expect a frequency of some updates every few months, but do not be too concerned if it takes longer – the time I dedicate to this topic varies.
The most recent files will always be available in my Github repository.
What Do You Get?
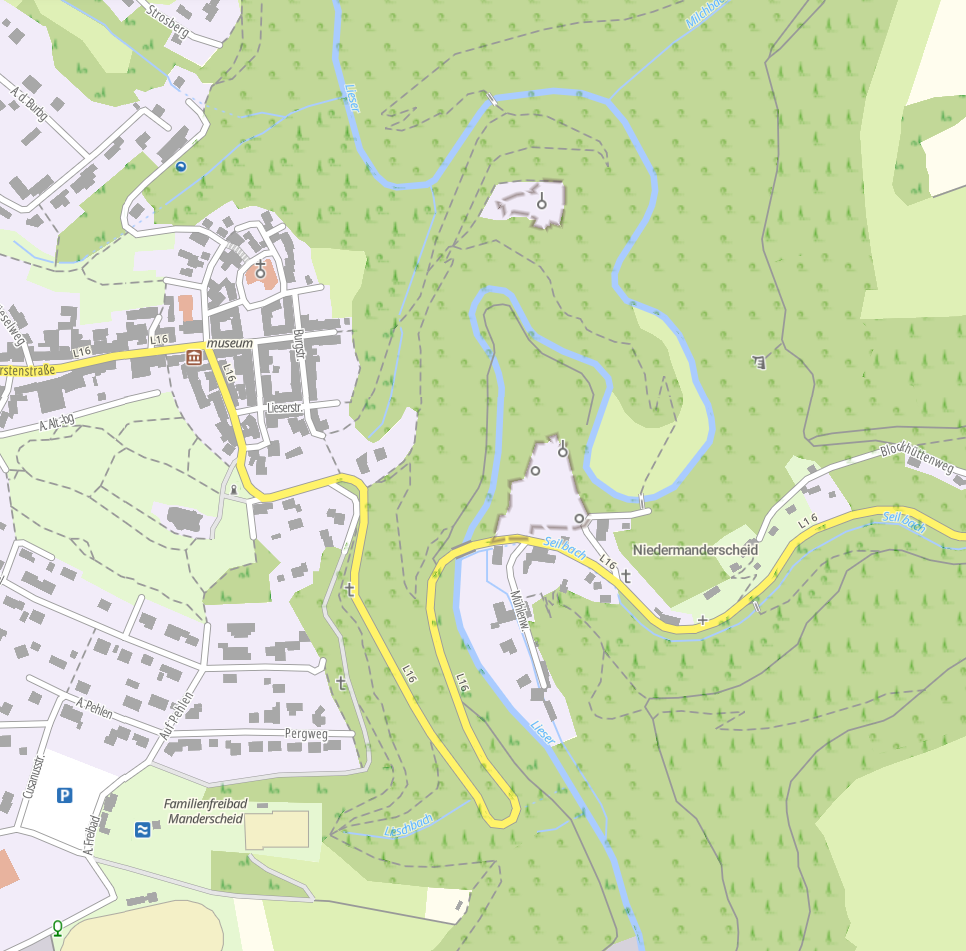
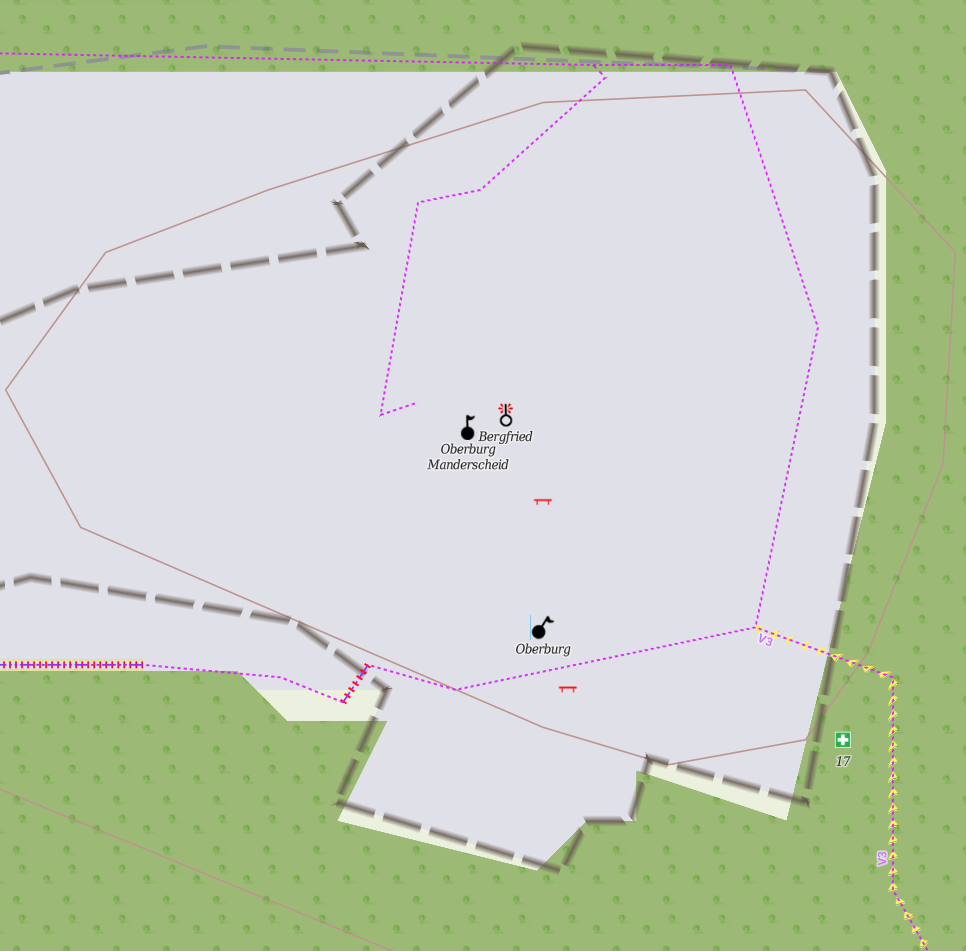
Before we jump into the implementation steps, here’s an introduction into the Superatlas rendering. The map base is the (slightly modified) rendering from basemap.de – here’s an example region around the beautiful castles of Manderscheid:
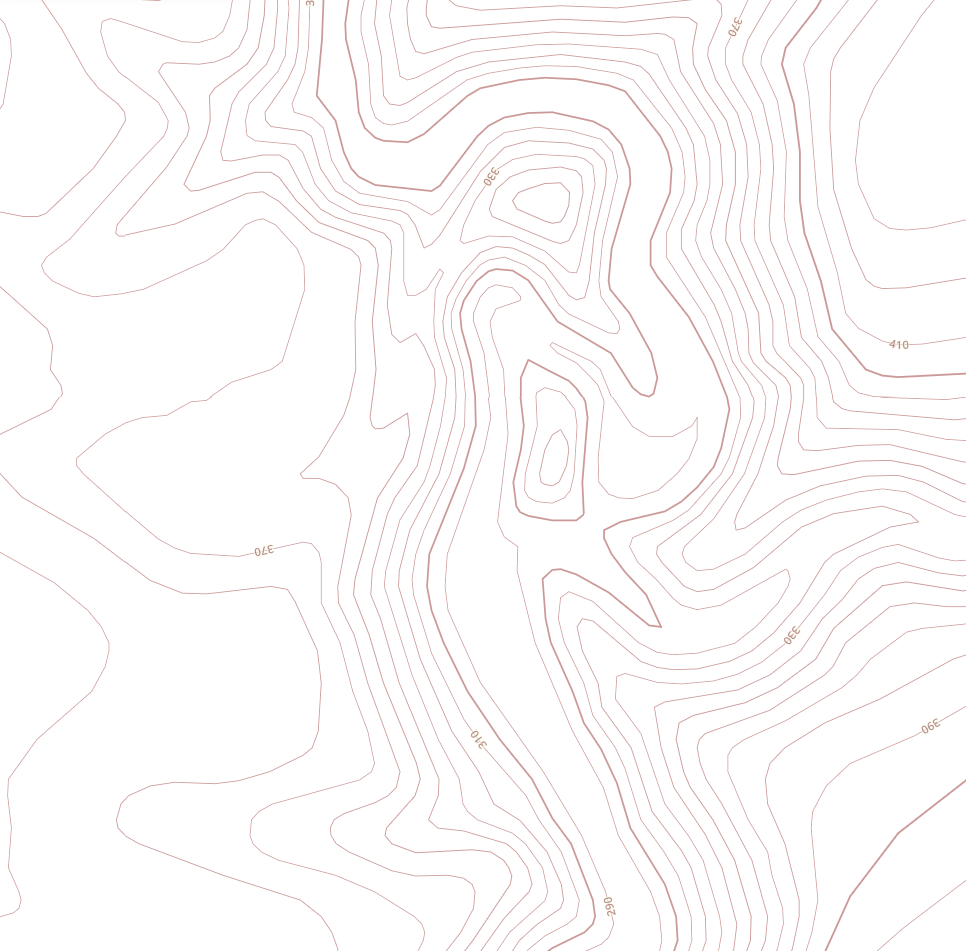
To this I add the contour lines, also from basemap.de:
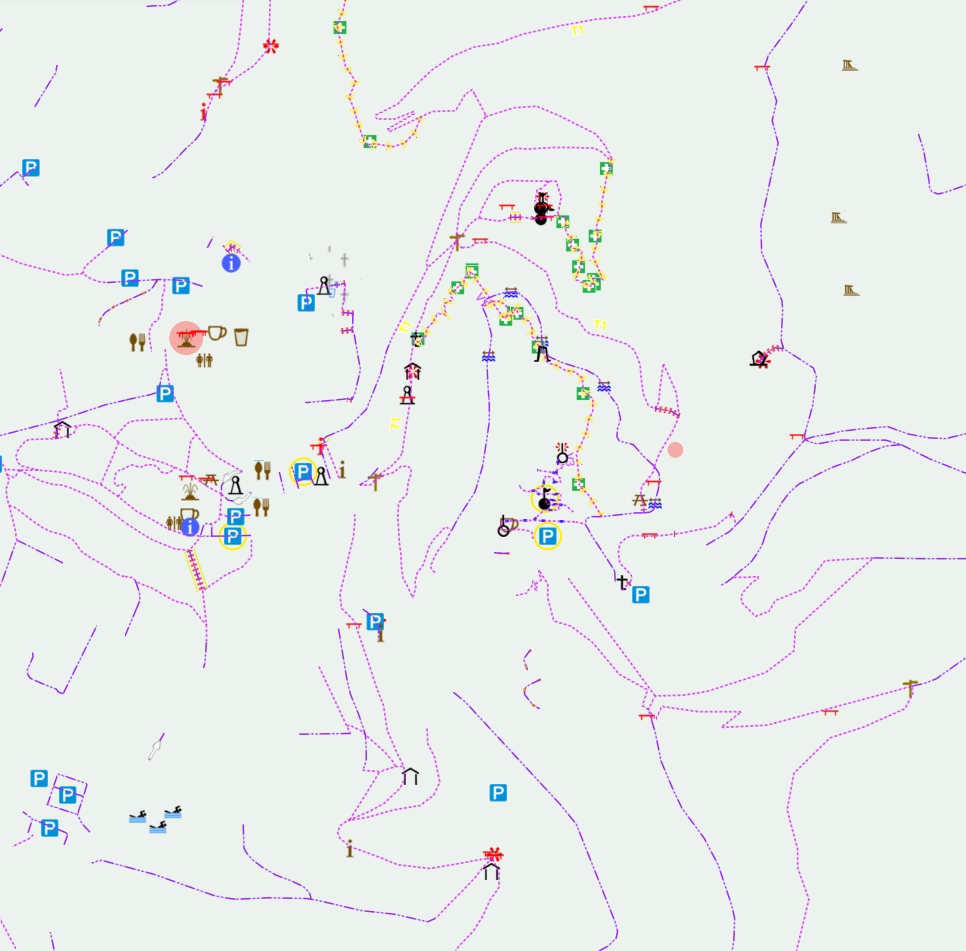
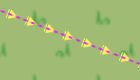
And finally, on top of that a layer based on OpenStreetMap (OSM) data, that shows a lot of Points of interest (POIs) and small ways like tracks and paths in a low-key rendering:
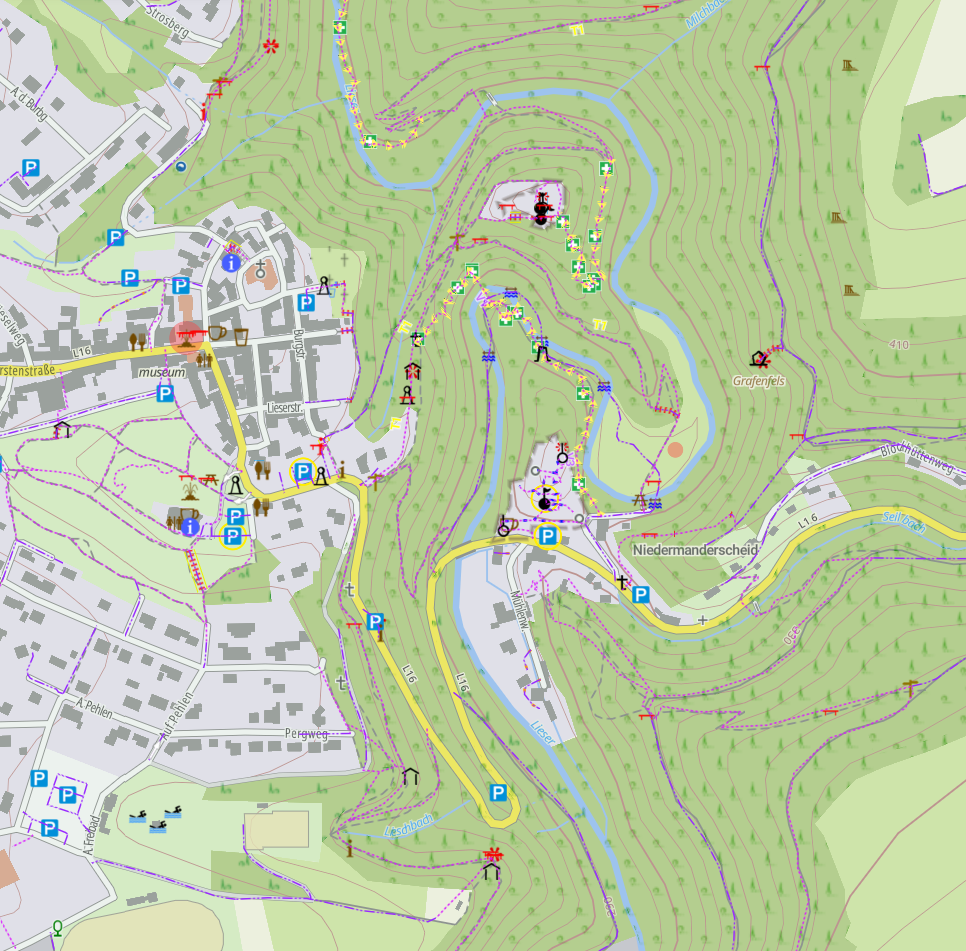
Putting this all together, you get a hiking-focused, feature-rich map. Besides adding all the hiking-relevant POIs, the map allows you to navigate all ways that are in the datasets of OSM and basemap.de – i.e. you will have ways that are only known to OSM and ways that are only in the basemap.de map without switching between the two maps:
And – for regions where the information-richness is a bit overwhelming, a deep zoom is possible (For more examples read Part I of this series):
For a detailed explanation of all symbols, there’s the legend for basemap.de, and that of my OSM rendering as an appendix to this post.
You like the idea, but not my style? Then make sure to read part III of this series – it enables you to create your own style and data selection!
One-Time Setup
OruxMaps Mapbox Subscription
The vector engine of OruxMaps is based on the Mapbox GL JS framework. This is a powerful Javascript based rendering framework for 2D and 3D maps, including 3D models of buildings etc. Unfortunately they now charge money for certain usages, and that’s why OruxMaps also only offers Mapbox-based vector maps as a paid premium feature. However, it is very fair-priced: 1€ per month, or 10€ per year. I’d call this affordable – I’d even call it a very good price for what you get. Still, as Mapbox started off as open source, there’s by now a fork, named Maplibre. This is free, and who knows, perhaps OruxMaps will at some point switch horses and you’ll get the vector maps for free. I seem to understand that Mapbox is developing much faster than Maplibre, but the fundamental things are there also in Maplibre.
If you want to have free vector maps in OruxMaps, you can use Mapsforge based vector maps. My main problem was that basemap.de uses the Mapbox/Maplibre scheme, and converting this to Mapsforge seems to be uncharted country – at least I could not find any tools for that.
As for now, in order to use Mapbox framework based vector maps, you need to subscribe to the OruxMaps featured maps, which you can do directly from the App.
Getting the Base Files onto the Smartphone – Mapbox/Maplibre Styles
Both frameworks – Mapbox and Maplibre – share the same fundamental basis: Vector data is delivered in tiles (like with raster maps). The tiles contain protobuf stored vector data. The rendering of the vector data is governed by a style file. The style is a JSON formatted file that…
- Defines data sources (which actually can be raster and vector, so it is possible to merge raster and vector maps!)
- Refers to one sprite, which is basically one large PNG image that contains the icons and symbols to use in the map, plus a JSON file that tells names, positions and sizes of these symbols within the PNG
- Makes use of glyphs, which is basically fonts
- Describes which kind of object is to be rendered how, in terms of lines, areas, texts and symbols. The rendering can be adaptive to zoom level (and other parameters), and the style may define how.
And that’s exactly what needs to go to the Smartphone:
- One or more style files
- The glyphs, which for every font contain 256 files, which contain the vector data for 256 unicode characters. I have absolutely no idea why this is done so complicated – why not make use of true type or open type fonts directly? But most likely it is my ignorance here – they’ll have their reasons, I suppose…
Each font gets a folder that contains the glyph files, again as protobuf stored data. - The sprite, i.e. the PNG and JSON file. The sprite goes in for different resolutions – to allow high dpi displays. So you have the base sprite, and a double resolution sprite that gets an “@2x” into its file names. I’ve also seen @3x and @4x, but OruxMaps seems to make use of the @2x files.
You can find the most recent version of all files in my Github repository. The files referred to here are all in the Superatlas directory in there. Put that directory into the OruxMaps mapfiles directory, or any alternative directory you configured to store offline map data. Make sure you have a subdirectory that contains all the stuff – if you follow me, the subdirectory would be “Superatlas”. But feel free to rename it. The directory structure should look like this:
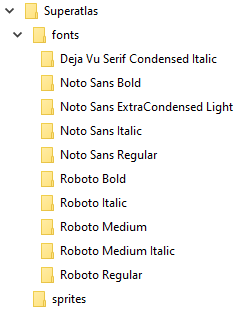
My style file is named superatlas.map.json – you may also rename it – just make sure it ends on .map.json – OruxMaps relies on that.
Install and Prepare tilemaker
tilemaker is a very nice piece of software by Richard Fairhurst et al. that can convert OpenStreetMap data into an mbtiles database, allowing to select which OSM objects and data goes into the database, which attributes are maintained etc. It also takes care of data simplification for the lesser zoom levels. Thanks for providing this very helpful piece of software! It exists for multiple platforms – either get it from Github, or, if you use Debian (like me), just do an apt install tilemaker.
You also need the OSM data filter LUA script, and the layer configuration file. Get mine from my Github repository – put them anywhere you can later locate them.
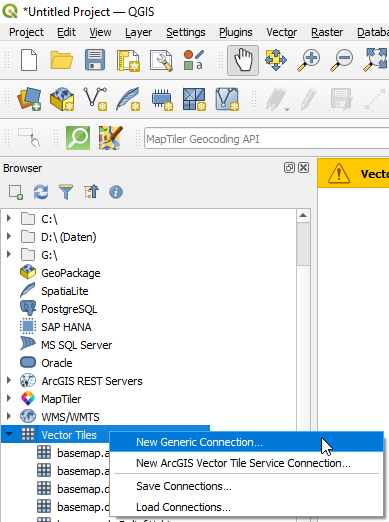
Install QGIS and add Datasources
QGIS is a powerful open source geo-information-system, powered by a considerable community – thanks to all of them! This tool is helpful to download the basemap.de vector tiles into an mbtiles database. Unfortunately I have yet not found a more elegant way to get the data. Please leave a comment if you know a good way! Some countries, like Switzerland or Austria, offer their complete vector map in one file for download – I asked the basemap.de team if they can do the same. Answer: We are currently considering it… Well, we’ll see.
Task for now: Get it for your platform and install it. On Debian run apt install qgis.
For basemap.de, you now need to add two data sources, one for the map data, and one for the contour lines. To do so, right-click on the “Vector tiles” entry in the QGIS tree structure and select “New Generic Connection…”:
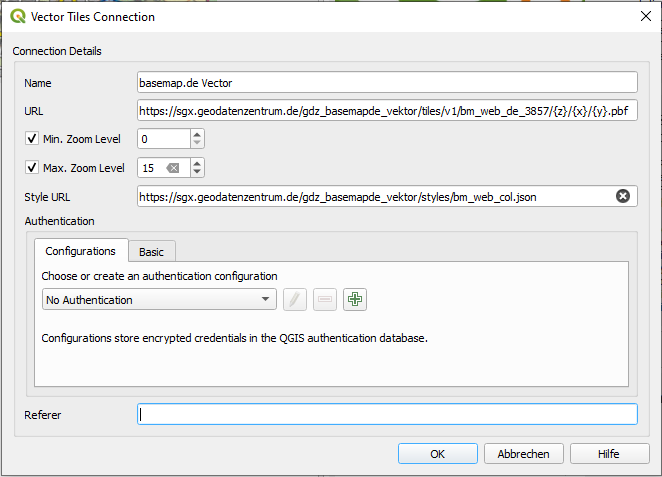
For the basemap.de map data, enter the following settings:
- Name: Your choice.
- URL: https://sgx.geodatenzentrum.de/gdz_basemapde_vektor/tiles/v1/bm_web_de_3857/{z}/{x}/{y}.pbf
- Min/Max Zoom Level: 0/15
- Style URL: https://sgx.geodatenzentrum.de/gdz_basemapde_vektor/styles/bm_web_col.json
Everything else remains on default settings:
For the contour lines the correct data is:
- Name: Your choice.
- URL: https://sgx.geodatenzentrum.de/gdz_basemapde_vektor/tiles/v1/bm_web_hl_de_3857/{z}/{x}/{y}.pbf
- Min/Max Zoom Level: 0/15
- Style URL: not needed (leave empty)
Optional: Install Osmosis
Osmosis is a powerfull open source OSM data manipulation tool (you may remember it from my – now somewhat obsolete – blog post on large region hiking maps). Thanks to the community providing this tool! You will need this tool only if you plan to create maps that are stitched together from several regions downloaded from Geofabrik. For example, if you plan not to have whole of Germany processed and stored, but only two or three states, you will need to merge them into one PBF file for tilemaker processing. Tilemaker itself can merge multiple PBFs, but it does it not in a very clever way, so I’d recommend to use Osmosis instead.
Get Osmosis for your platform via Github, or – you guessed it – on Debian run apt install osmosis.
Create Your Map
One time setup finished – the following steps are needed each time you want new map data.
Download OSM Data From Geofabrik
Geofabrik is a strong supporter of OpenStreetMap – many thanks to them! They provide daily dumps of OSM data as download in several formats. You can get them by continent, country, and for larger countries also for states or even administrative districts. So go to the Geofabrik downloads page and pick the region you need. Choose the “.osm.pbf” file format. For Germany, the download link is https://download.geofabrik.de/europe/germany-latest.osm.pbf, and as of this writing, it was 4.1 GB in size. Store the file where you later can find it for tilemaker processing.
Optional: Merge Several PBF Files into one
As mentioned before – if you want to have smaller files, you may just want to download a few smaller regions and put them together. Me, living in North-Rhine-Westfalia and close to the border of Rhineland-Palatinate, had my first downloads only for these states – adding Hessia, as I often hike there in the Westerwald or Hunsrück. So imagine having NRW.pbf, RLP.pbf and HE.pbf as files for the states. Each Osmosis step can merge two files, so the process would be:
|
1 2 |
osmosis --rb NRW.pbf --rb RLP.pbf --merge --wb temp.pbf osmosis --rb temp.pbf --rb HE.pbf --merge --wb final.pbf |
And you’d need one step for each additional PBF file, working with temporary PBFs inbetween.
Creating the mbtiles Database via tilemaker
You need to run
|
1 |
tilemaker --input /path/to/YOUR_REGION.pbf --output /path/to/YOUR.mbtiles --config /path/to/config.json --process /path/to/process.lua --store /path/to/a/fast/disk/ |
The files are:
- /path/to/YOUR_REGION.pbf
The PBF file you downloaded in the first step from Geofabrik, or which is the final, merged PBF from the optional step 2. - /path/to/YOUR.mbtiles
Target file to store the vector map data in – choose whatever you like. If you want to use my style files directly, make sure you name it superatlas.mbtiles. - /path/to/config.json
The layer configuration – you have downloaded it from my Github in the one-time-setup section. - /path/to/process.lua
The OSM filtering script – also from my Github. - /path/to/a/fast/disk/
If tilemaker need to process large regions, sometimes it cannot do so fully in RAM. The authors recommend to identify a fast (SSD) drive where tilemaker can temporarily store data to. You may try without the ––store option if you have a powerful PC with lots of RAM, or if you only process moderate regions. NRW + RLP worked for me without the ––store option.
Processing for whole Germany on my moderately powerful Intel NUC takes about 10 minutes.
Download basmeap.de Map Data via QGIS
To get the basemap.de map data into an mbtiles file, do the following steps:
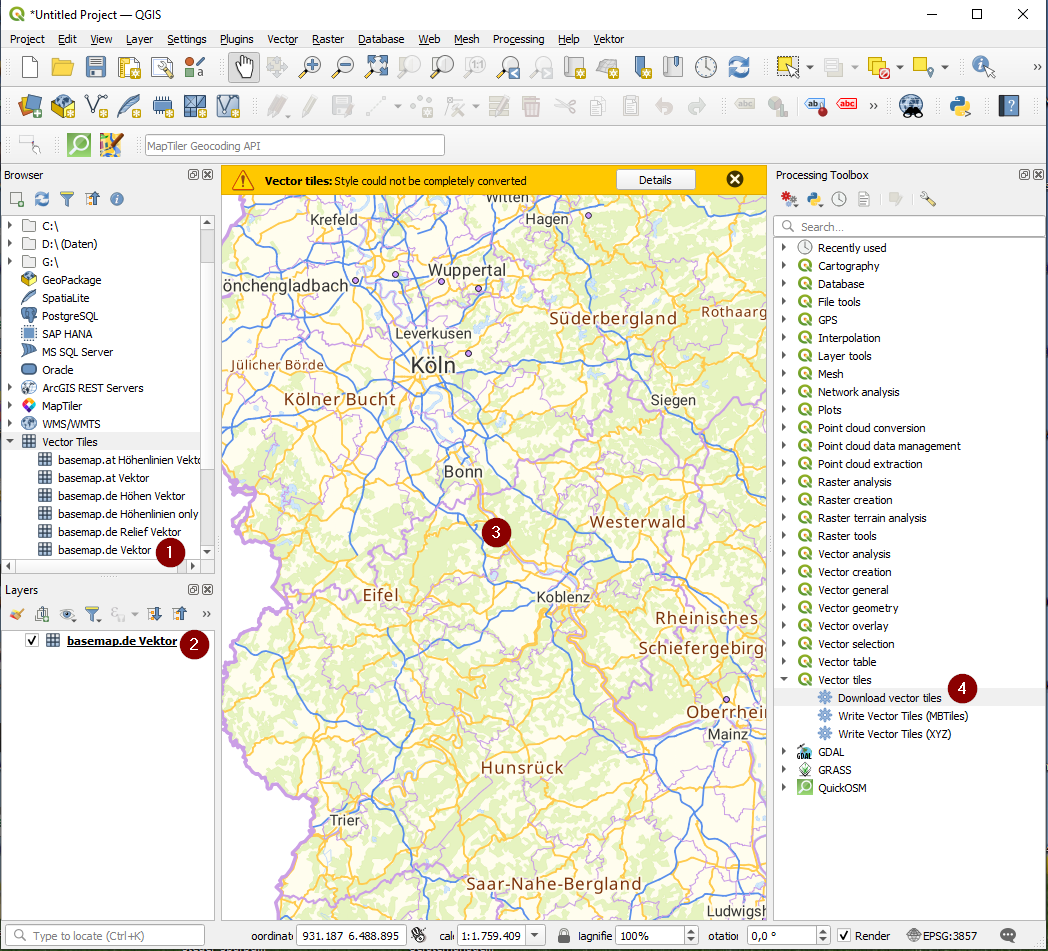
- Add the basemap.de vector data source (the one you created during one time setup) to your project (e.g. by double clicking it) – ignore the warning about the style.
- Click on it in your project layers list
- Zoom in so that you have the region you want to save completely visible in the window
- In the Processing toolbox on the right, navigate to “Vector tiles” and double click on “Download vector tiles”
This opens a dialog:
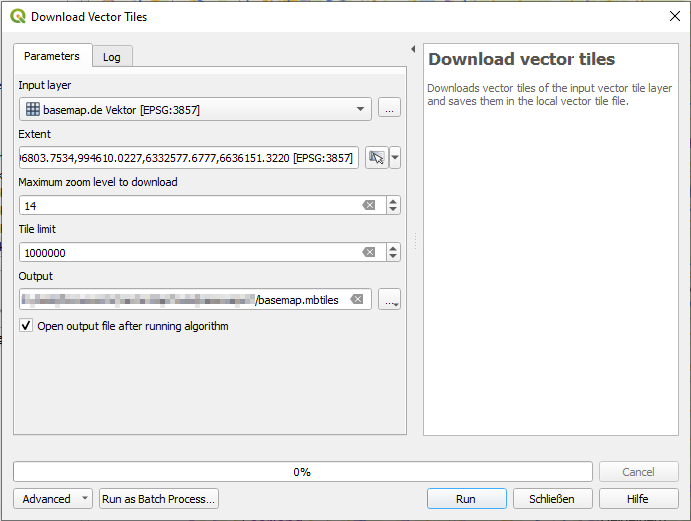
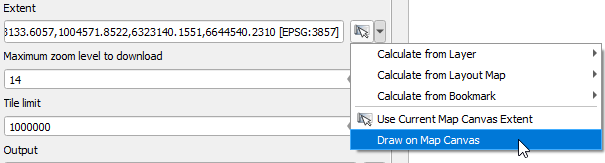
Make sure that the basemap.de data source is selected. Then, under “Extent”, click on the downward arrow at the right and select “Draw on Map Canvas”. The dialog will vanish, and you now can mark the region you want to save the tiles from as a rectangle on the map. After that, the coordinates will be in the “Extent” field. Important: If you plan to also download contour lines (which I recommend), copy the content of the “Extent” field. You will need it later when downloading the contour lines for the same region.
As “Maximum zoom level to download” give 14. You may also go to 15, but IMHO the added data is not worth the necessary space. I’ll at some point will even try to go down to 13 and see how much I miss in the end.
As “Tile limit” give a huge number – at least 6 digit, better 7.
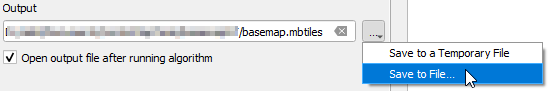
Finally, under “Output” click on the arrow to the right and select “Save to File…” and give the target file name and directory. If you want to use my style file directly, name the file basemap.mbtiles.
Now click on “Run” and let QGIS do its job – depending on the size of the region a bit of patience is required.
Optional: Download basmeap.de Contour Line Data via QGIS
The contour lines from basemap.de are excellent, I recommend to include them! For the contour lines, the process is the same as for the map data above, except for the following points:
- The data source is of course the contour lines data source you configured during one time setup.
- Instead of marking the region on the map, paste the “Extent” field value you copied earlier into the “Extent” field here.
- For maximum zoom level give 13 – this includes contour lines spaced by 10 m. Only if you want them finer, download higher zoom levels.
- If you want to use my style as it is, name the target file basemap_contour.mbtiles.
Copy the mbtiles Files to You Smartphone
The two or three mbtiles files that you created in the previous steps (OSM layer from tilemaker, basemap.de map data, and optionally basemap.de contour lines) now need to be copied into the same directory where the style file resides, i.e. into the subfolder you created in the mapfiles directory of OruxMaps during one time setup steps.
If you followed the names and zoom levels I suggested above, and if you did all three mbtiles files, that’s it. If you only have two mbtiles files or chose different names or zoom levels, you’ll need to modify the style file:
- If you want to change the map name (which is shown nowhere 🙂 ), modify line 3
- If you changed the name of the basemap.de mbtiles file, modify line 16
- If you changed the maximum zoom level when storing the basemap.de map data, modify line 20
- If you changed the name of the OSM layer mbtiles file, modify line 25
- If you do not have a basemap.de contour line file, delete lines 30-38
- If you changed the name of the basemap.de contour lines mbtiles file, modify line 34
- If you changed the maximum zoom level when storing the basemap.de contour line data, modify line 38
|
1 2 3 4 5 6 7 8 9 10 11 12 13 14 15 16 17 18 19 20 21 22 23 24 25 26 27 28 29 30 31 32 33 34 35 36 37 38 39 40 41 |
{ "version": 8, "name": "Superatlas", "metadata": { "basemapde:style-version": 3.1, "mapbox:autocomposite": false, "mapbox:type": "template", "maputnik:renderer": "mbgljs" }, "center": [10, 51], "zoom": 6, "sources": { "smarttiles_de": { "type": "vector", "tiles": [ "http://localhost:8998/basemap.mbtiles/{z}/{x}/{y}.pbf" ], "attribution": "© 2023 basemap.de / BKG | Datenquellen: © GeoBasis-DE", "minzoom": 0, "maxzoom": 14 }, "OSM-tiles": { "type": "vector", "tiles": [ "http://localhost:8998/superatlas.mbtiles/{z}/{x}/{y}.pbf" ], "attribution": "© OpenStreetMap", "minzoom": 9, "maxzoom": 13 }, "smarttilesHL_de": { "type": "vector", "tiles": [ "http://localhost:8998/basemap_contour.mbtiles/{z}/{x}/{y}.pbf" ], "attribution": "© 2023 basemap.de / BKG | Datenquellen: © GeoBasis-DE", "minzoom": 0, "maxzoom": 13 } }, [...] |
You may have noticed that I did not include hillshading into my map – as opposed to my raster Superatlas. This is because OruxMaps can do hillshading by its own! No need to include it here.
Reload the Offline Maps in OruxMaps
For OruxMaps to pick up the new maps, you may need to go to the “load maps” page in OruxMaps and tap the “Reload” button (the two arrows in a circle). Please note, that the Mapbox format maps are not to be found under the Offline maps as you might expect, but under “Online” – “MAPBOX JSON”. If you followed my example, there’ll be a folder named Superatlas, and in it an entry “superatlas”. Select that, and enjoy the new maps!
Current Situation: Workaround needed for an OruxMaps Bug (Three Options)
As of this writing, OruxMaps has an annoying bug. This is related to the internal structure of the map data delivery and rendering. The data delivery is done via an internal tile server (which is why the datasources in the JSON style file start with http://localhost:8998/…), which is queried by the Mapbox GL JS framework. This framework then takes care of rendering the data, and also caches the rendered pages for faster access after first rendering. When you for the first time open OruxMaps and load the map, all is fine. You can scroll and zoom around in the map as much as you like. But if you send OruxMaps into the background – it is enough to once lock the smartphone screen – and pull it up again, the tile server has died. All parts of the map that you have previously viewed are still in the cache and you can browse them, but if you go to areas or zoom levels that you did not go to before, no new data is served and your map is incomplete or even partly missing. To restart the tile server, you either need to restart OruxMaps, or you need to load any other map and then switch back to the one you want. After that, it works again until OruxMaps is put into background again. So that would be workaround number one: Switch maps away and back.
Workaround option number two is that before you start a tour, at the first start of OruxMaps you pan and zoom the complete area you plan to hike around in at all desired zoom levels. This builds up the cache, and it stays stable as long as OruxMaps keeps running. That’s what I did until recently. Now I am using Workaround number three:
There is a small App named Mobile Tile Server, which does basically the same as the OruxMaps internal tile server: It takes an mbtiles file and serves the tile data in that. The author of that, Bogdan Hristozov, was very helpful and adjusted it to work with OruxMaps – my many thanks to his support! As of this writing, the newest version did not pass the Google Play store checks yet and was not available via Play, but the APK from Github installs just fine. If you use this tile server as data source instead of the OruxMaps builtin tile server, things are stable, even if you put OruxMaps into the background.
The necessary steps are:
- Rename the Superatlas Directory in the OruxMaps mapfiles directory to mbtiles
The reason is that Mobile Tile Server expects the mbtiles files in a directory that is named mbtiles. - Configure Mobile Tile Server to serve data from the mapfiles directory
For this, navigate to the settings of Mobile Tile Server and tap on “Tiles root directory path”. Unfortunately there is no directory browser, you need to type the path – so as a preparation make sure you have this path at hand, e.g. by looking into the OruxMaps configuration. You need the path to the mapfiles directory which then contains the mbtiles directory. More specific, if your mbtiles files are in /storage/oruxmaps/mapfiles/mbtiles/, the root directory path should be /storage/oruxmaps/mapfiles. - Configure background activity of Mobile Tiles Server
To make sure that the Mobile Tile Server runs in the background and keeps running, you need to adjust the Android power settings of the App to “Unrestricted”. - Change the superatlas.map.json to use Mobile Tile Server
The URL for mbtiles access of the Mobile Server is http://localhost:1886/mbtiles/YourMbtilesFile.mbtiles/{z}/{x}/{y} – so the superatlas.map.json needs the following adjustments:
|
1 2 3 4 5 6 7 8 9 10 11 12 13 14 15 16 17 18 19 20 21 22 23 24 25 26 27 28 29 30 31 32 33 34 35 36 37 38 39 40 41 |
{ "version": 8, "name": "Superatlas", "metadata": { "basemapde:style-version": 3.1, "mapbox:autocomposite": false, "mapbox:type": "template", "maputnik:renderer": "mbgljs" }, "center": [10, 51], "zoom": 6, "sources": { "smarttiles_de": { "type": "vector", "tiles": [ "http://localhost:1886/mbtiles/basemap.mbtiles/{z}/{x}/{y}" ], "attribution": "© 2023 basemap.de / BKG | Datenquellen: © GeoBasis-DE", "minzoom": 0, "maxzoom": 14 }, "OSM-tiles": { "type": "vector", "tiles": [ "http://localhost:1886/mbtiles/superatlas.mbtiles/{z}/{x}/{y}" ], "attribution": "© OpenStreetMap", "minzoom": 9, "maxzoom": 13 }, "smarttilesHL_de": { "type": "vector", "tiles": [ "http://localhost:1886/mbtiles/basemap_contour.mbtiles/{z}/{x}/{y}" ], "attribution": "© 2023 basemap.de / BKG | Datenquellen: © GeoBasis-DE", "minzoom": 0, "maxzoom": 13 } }, [...] |
Again, reload offline maps in OruxMaps, and you’re good to go.
Whenever now you are using the Mapbox maps in OruxMaps, make sure that you have started the Mobile Tile Server App before, and in the App tapped the “Start” button.
Consider to Contribute to OpenStreetMap!
The high information quality of the maps presented here is only possible because thousands of people (among them me) contribute actively to OpenStreetMap. We map new ways, add points of interest, update and improve existing data and thereby keep the data valuable and accurate. There are many areas still not fully mapped in OSM, and as the world constantly changes, the task to update data will never end. And contributing is surprisingly easy!
The simplest way to contribute is using StreetComplete, which requires near to no knowledge about mapping and OSM data formats – all you need is a Smartphone with GPS. When you take your evening stroll or walk your dog, StreetComplete will ask you simple questions, like “how many storeys does the building in front of you have?” or “Does the street you are walking down have sidewalks?”. By answering them, you improve existing map data in OSM.
If you want to contribute more, e.g. new ways or points of interest, you will need to learn the basics about editing OSM data. The fundamental concepts are easy to grasp, and the available editors are easy to use and provide templates that allow you to enter data correctly without too much of a learning curve. The OSM wiki, more precisely the “Contribute map data” page is a good starting point, including a beginner’s guide. I’d go so far that if you’re tech savvy and more the “learning by doing” type, you do not even need to read too much, you can jump right in, and by looking at existing map data, and using the templates the editors provide IMHO is enough to get up’n’running very quickly.
Finally, there are other ways how to contribute to OSM – follow the link and read all about it!
My Workflow
For what its worth, here’s my workflow how I contribute to OSM – of course using fantastic OruxMaps!
- Take Photo Waypoints of missing or incorrect OSM objects
During a hiking tour, I observe the map (anyhow for navigation) and look for things that are missing or wrong – e.g. if I pass by a bench I check if this is already in OSM. If something I care about is not or inaccurately in OSM, I use the OruxMaps Photo Waypoint to make a photo of the regarding situation (of course I do a recording of my hiking tour, so that the photo waypoints are connected to the tour!). That’s all I do during hiking – I want to enjoy the tour and not fiddle too much with technology. Taking a photo waypoint is a matter of seconds and for me (and my wife) compatible with enjoying the hike. I tried the Vespucci smartphone OSM editor once, but it quickly became clear that editing OSM data directly on a tiny smartphone touch display while being in the field, spoils the fun of hiking – at leat for me. - Updating OSM data in JOSM
After the tour, when I have a bit of time at my hands, I fire up my favourite OSM editor, which is the Java Open Street Map editor (JOSM). It appeals to my way of thinking and computer usage – but iD, the now “official” online OSM data editor, which you can start directly from the OSM map by clicking on the “Edit” button, has evolved so much I can wholeheartedly recommend it.
In JOSM I load the GPX track from OruxMaps that I have taken during my hiking tour and that contains all the photo waypoints. Now I walk through my waypoint images and make my additions and modifications to the OSM data. The photos help me to remember what I found that needs improvement, and also helps to add names, inscriptions etc.
It is extremely helpful to load satellite imagery as a JOSM background – IMHO the ESRI images are the best. These help to precisely place objects, improve ways or add new ways. If the situation is very clear, I often even map ways I have not been walking along, but which I have passed and can confidently say that they exist.
And that’s basically it – processing a typical, 5 hours hiking tour is usually a matter of less than one hour of working in the editor. I try to be as precise as I can, but if a bench or a guidepost is not utterly exactly where it is in nature, I do not care. The information that a guidepost is at a given crossing is much more valuable than the information if it is a bit more left or right.
Superatlas helps me to optimize my OSM contribution: If my route planning allows to take a way that is only in basemap.de but is missing in OSM, I change my route slightly to go there, if it is not conflicting with other objectives. This allows me to accurately map the way as a new one in OSM.
So, don’t be shy, take my word: OSM contibution is easy!
Appendix: Superatlas Legend
This is a detailed explanation of the symbols used in my OSM layer.
| Symbol | Meaning |
| Castle/Palace/Castle (ruins)/Palace (ruins) | |
| Church/Monastery/Church (ruins)/Monastery (ruins) | |
| Chapel/Chapel (ruins) | |
| Shrine/Place of worship: Christian | |
| Cross/Wayside cross | |
| Mosque/Mosque (ruins) | |
| Synagogue/Synagogue (ruins) | |
| Place of worship: islamic/jewish | |
| Place of worship/Temple | |
| Ruins (anything tagged ruins=yes that is not covered by more specific symbols) | |
| Gallows, Pillory | |
| Memorial/Monument | |
| Boundary stone/Milestone | |
| Tombstone/Rune stone/Historic stone | |
| Survey point | |
| Fort/Battlefield | |
| City gate | |
| Historic aqueduct (line feature/POI) | |
| Dolmen | |
| Archaeological site | |
| Art | |
| Viewpoint | |
| Guidepost | |
| Parking lot | |
| Restaurant/Café/Ice Cream/Pub | |
| Toilet | |
| Tower/Observation tower/Communications tower | |
| Lighthouse/Beacon | |
| Windmill/Watermill | |
| Observatory/Telescope | |
| Cave/Adit, mine | |
| Rock/Stone | |
| Broadleaved tree/Conifer/Tree | |
| Information board/Tourist information/Hiking map | |
| Emergency access point | |
| Bench | |
| picnic area/picnic shelter | |
| Fireplace | |
| Shelter/Wilderness hut/Alpine hut/Ranger station | |
| Bird/Wild hide | |
| Spring/Hot spring/Waterfall | |
| Well/Fountain | |
| Geyser | |
| Tap, Drinking water, Waterpoint | |
| Swimming | |
| Climbing | |
 |
Ford |
 |
Deciduous forest |
 |
Coniferous forest |
 |
Mixed forest |
 |
Forest |
 |
Scrubland |
| Orchard | |
 |
Moor (area/POI) |
 |
Heath (area/POI) |
 |
Vineyard (area/POI) |
| Bare rock | |
| Scree | |
 |
Peak |
| Glacier, Ice | |
 |
Precipice, Cliff (line/POI) |
| Ridge | |
| Embankment, Outcrop | |
| Rampart, Dike | |
 |
Gully |
| Quarry | |
| Cemetery | |
 |
Tourist attraction (minor/major + area) |
| Protected area | |
 |
Zoo |
 |
Highway/Path (only smaller ways are rendered, typically tracks or paths) |
 |
Highway or Path: abandoned and/or badly visible |
  |
Stairs/Handrail |
 |
Boardwalk |

|
No access (POI/area/way) |

|
Private (POI/area/way) |

|
Access for customers or with other permit (POI/area/way) |

|
Fee required for access (POI/area/way) |
 |
Conditional access (only ways, may be combined with other access features) |
 |
Via ferrata and/or climbing aids (rungs, ladders, cables, …) |
|
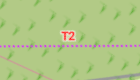
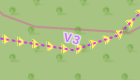
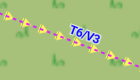
Hiking difficulty scales. These follow the Swiss Alpine Club (SAC) difficulty scale and are rendered in the recommended colors, i.e. T1, T2, T3, T4, T5 and T6. Also rendered is the via ferrata scale if available – rendering looks like V1+. If both are available, both are given and the color follows the SAC scheme. |


You do not like the symbols, colors, data, fonts etc. used here? Read part III – it teaches you how to adjust things to your liking!